|
|
|
报告导航:研究报告—
金融与服务业—旅游休闲
|
|
2012-2015年全球及中国动漫行业研究报告 |
 |
字数:4.3万 |
页数:116 |
图表数:107 |
|
中文电子版:8000元 |
中文纸版:4000元 |
中文(电子+纸)版:8500元 |
|
英文电子版:2300美元 |
英文纸版:2400美元 |
英文(电子+纸)版:2600美元 |
|
编号:LMX030
|
发布日期:2013-03 |
附件:下载 |
 |
|
|
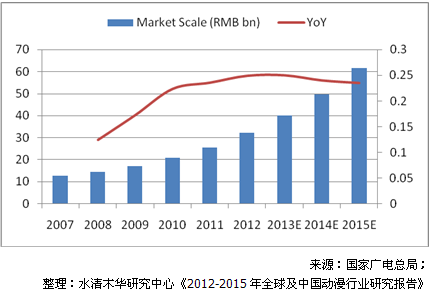
目前,全球动漫产业产值达2228亿美元,与动画相关的衍生产品产值超过5000亿美元。动漫产业已逐渐成为一些国家国民经济的支柱和新的经济增长点。美国动漫已成为全美第六大支柱产业;日本动漫业已超过汽车、钢铁工业,成为日本第三大产业;韩国承接了全球近1/3的动漫制作业务。 相比美日韩等发达国家,中国动漫产业尚处于起步阶段。2012年中国动漫市场规模达321亿元人民币,同比增长24.9%。我们认为,未来随着动漫全产业链消费的启动以及国家政策的扶持,中国动漫产业将会有更加广阔的发展空间。 图:2007-2015年中国动漫产业市场规模及预测
 动漫产业的盈利收入不仅来自动漫内容制作(动画片、动漫电影等),更来自于衍生品(动漫玩具、动漫服饰、主题公园等)。目前中国动漫产业完整的产业链正在逐步形成,但是与美日等国家不同的是,中国目前出现了逆产业链的现象,也就是有的企业先发展衍生品,再反哺原创动漫。这种经营模式的代表企业是奥飞动漫以及骅威股份。 奥飞动漫目前已经形成了内容链(“铠甲勇士”、“火力少年王”、“巴啦啦小魔仙”等动漫形象)—媒体链(嘉佳卡通等)—玩具链(陀螺等系列产品及渠道网络)—婴童链(“澳贝”、 “LUCKY UNION”等品牌及渠道网络)的完整大动漫产业链条,同时通过对外合作和投资并购不断强化这一产业链。 2012年10月11日,奥飞动漫与孩之宝在上海正式签署协议。双方建立长期战略伙伴关系,并共同投资1500万美元成立合资公司,开发、设计动漫玩具和相关衍生产品,在全球范围内分销产品和开展品牌授权。 《2012-2015年全球及中国动漫行业研究报告》主要从以下几个方面研究了整个动漫产业的发展状况:
- 全球动漫产业发展概况,包括全球主要动漫产业基地美国和日本的动漫产业发展模式及盈利模式;
- 中国动漫产业整体概况,包括政策扶持、市场规模、企业类型、发展现状及未来发展趋势;
- 中国动漫衍生产业分析,包括动漫玩具、动漫服饰、主题公园等衍生产业的行业发展状况;
- 7家跨国企业及14家中国动漫企业分析。
So far, the output value of global animation industry has reached
US$222.8 billion, and animation-related derivatives have exceeded US$500
billion. The animation industry has gradually become a pillar of the
national economy and new economic growth engine in some countries.
American animation has developed as the America’s sixth largest pillar
industry; in Japan, the animation industry has outperformed automobile,
iron & steel industries to be the third largest industry; and South
Korea has undertaken a nearly 1/3 of the global animation production
business. Compared to the United States, Japan, South Korea and
other developed countries, China’s animation industry is still in its
infancy. Chinese animation market size in 2012 reached RMB32.1 billion, a
year-on-year increase of 24.9%. We hold the opinion that with the
start-up of the animation industry chain consumption as well as the
support of national policies, there will be more broad space for
development of the Chinese animation industry. Market Scale of Animation Industry in China, 2007-2015E
For
the animation industry, earnings and revenue come not only from the
animation content production (cartoons, animation movies, etc.), but
also from derivatives (cartoon toys, anime costumes, theme parks, etc.).
At present, a complete industrial chain of Chinese animation industry
is taking shape, but different from the United States, Japan and other
countries, there appears the phenomenon of inverse industrial chain,
i.e. some enterprises set out to develop derivatives, and then nurse the
original animation, represented by companies with such operation mode
including Guangdong Alpha Animation and Culture Co.,Ltd and Guangdong
Huawei Toys Craft Co., Ltd.. Alpha Animation has now established
a complete animation industry chain, covering content chain (anime
images like “Armor Hero”, “Blazing Teens”, “Balala Little Magic Fairy”) –
media chain (Jia Jia Cartoon) – toy chain (gyro, etc. series products
and channel network) – baby chain (“AUBY”, “LUCKY UNION”, etc. brands
and channel network), which is being consistently strengthened through
foreign cooperation, investment, mergers and acquisitions. October
11, 2012, Alpha Animation signed an official agreement with Hasbro in
Shanghai. The two sides establish a long-term strategic partnership and
co-invest US$15 million to set up joint venture, in a bid to develop and
design cartoon toys and related derivative products, distribute
products and launch brand licensing on a global scale. Global and China Animation Industry Report, 2012-2015 mainly covers the followings:
Development of global animation industry, including development model
and profit model of major global animation industry bases e.g. the
United States and Japan’s animation industry;
Overview of the Chinese animation industry, covering policy support,
market size, business type, development status and future trends; Animation derivative industries in China, involving cartoon toys, anime apparel, theme parks, etc.; 7 multinational companies and 14 Chinese animation companies.
第一章 动漫行业的基本介绍
1.1 基本概念
1.2 产业链
1.3 经营模式
1.4 经济特性
1.5 发展特点
第二章 全球动漫行业发展概况
2.1 整体发展概况
2.2 美国动漫产业发展情况
2.2.1 产业概况
2.2.2 发展历程
2.2.3 发展模式
2.3 日本动漫产业发展情况
2.3.1 产业概况
2.3.2 发展历程
2.3.3 产业链及盈利模式
第三章 中国动漫行业发展概况
3.1 政策扶持
3.2 市场规模
3.3 动漫企业分析
3.3.1 制作型公司
3.3.2 媒体型公司
3.3.3 整合运营型公司
3.3.4 总结
3.4 发展中存在的问题
3.5 发展前景
第四章 中国动漫制作和传播发行市场
4.1电视动画
4.2 动漫电影
4.2.1 市场规模
4.2.2 产量情况
4.3 漫画
第五章 中国动漫衍生产业分析
5.1 手机动漫行业分析
5.1.1 发展环境
5.1.2发展潜力
5.1.3 发展瓶颈
5.2 动漫衍生产品分析
5.2.1 动漫玩具
5.2.2动漫服饰
5.2.3 主题公园
5.3 动漫产业基地分析
5.3.1 产业基地概述
5.3.2 运作模式
第六章 国外动漫行业重点企业分析
6.1 Disney
6.1.1 公司简介
6.1.2 经营状况
6.1.3 收购Lucasfilm
6.1.4 Industrial Architecture and Business Model
6.2 Bandai Namco Group
6.2.1 公司简介
6.2.2 经营状况
6.2.3 发展战略
6.3 DreamWorks
6.3.1 公司简介
6.3.2 经营状况
6.4 Pixar Animation
6.4.1 公司简介
6.4.2 经营状况
6.5 Toei Animation
6.5.1 公司简介
6.5.2 经营状况
6.6 Sotsu
6.6.1 公司简介
6.6.2 经营状况
6.7 Studio Ghibli
第七章 中国动漫行业重点分析
7.1 奥飞动漫
7.1.1 公司简介
7.1.2 发展历程
7.1.3 经营状况
7.1.4 营收构成
7.1.5 竞争优势
7.1.6 牵手孩子宝
7.1.7 发展大动漫全业务
7.1.8 业绩预测
7.2 拓维信息
7.2.1 公司简介
7.2.2 发展历程
7.2.3 经营状况
7.2.4 营收构成
7.2.5 动漫业务
7.2.6 毛利率
7.2.7 发展战略
7.2.8 业绩预测
7.3 炫动传播
7.3.1 公司简介
7.3.2 经营状况
7.3.3 与百视通合作
7.4 骅威股份
7.4.1 公司介绍
7.4.2 主要产品
7.4.3 经营状况
7.4.4 营收构成
7.4.5 毛利率
7.4.6 研发投入
7.4.7 “动漫+玩具”商业模式
7.4.8 主要客户
7.4.9 主要项目
7.4.10 业绩预测
7.5 环球数码
7.5.1 公司简介
7.5.2 发展历程
7.5.3 经营状况
7.6 原创动力
7.7 江通动画
7.7.1 公司简介
7.7.2 经营状况
7.7.3 发展规划
7.8 宏梦卡通
8.8.1 公司简介
7.8.2 发展历程
7.8.3 经营状况
7.9 天络行
7.9.1 公司简介
7.9.2 发展历程
7.10 央视动画
7.11 三辰卡通
7.12 中南卡通
7.13 三浦灵狐
7.14 山猫卡通
Preface
1. Overview of Animation Industry
1.1 Definition
1.2 Industrial Chain
1.3 Business Model
1.4 Economic Characteristics
1.5 Development Features
2. Animation Industry in Foreign Countries and Regions
2.1 Global Overview
2.2 Animation Industry in the United States
2.2.1 Overview
2.2.2 Development History
2.2.3 Development Model
2.3 Animation Industry in Japan
2.3.1 Overview
2.3.2 Development History
2.3.3 Industrial Chain and Profit Model
3. Overview of China Animation Industry
3.1 Policy Support
3.2 Market Scale
3.3 Enterprises Analysis
3.3.1 Production Type
3.3.2 Media Type
3.3.3 Integrated Operational Type
3.3.4 Summary
3.4 Existing Problems
3.5 Development Prospect
4. Animation Production and Distribution Markets in China
4.1 TV Animation
4.2 Animated Film
4.2.1 Market Scale
4.2.2 Output
4.3 Cartoon
5. Animation Derivative Industry
5.1 Analysis of Mobile Phone Animation
5.1.1 Development Environment
5.1.2 Development Potential
5.1.3 Development Bottlenecks
5.2 Analysis of Animation Derivative Product
5.2.1 Animation Toy
5.2.2 Animation Apparel
5.2.3 Theme Park
5.3 Analysis of Animation Industry Base
5.3.1 Overview
5.3.2 Operation Mode
6. Typical Enterprises in Global Animation Industry
6.1 Disney
6.1.1 Profile
6.1.2 Operation
6.1.3 Acquisition of Lucasfilm
6.1.4 Industrial Architecture and Business Model
6.2 Bandai Namco Group
6.2.1 Profile
6.2.2 Operation
6.2.3 Strategy
6.3 DreamWorks
6.3.1 Profile
6.3.2 Operation
6.4 Pixar Animation
6.4.1 Profile
6.4.2 Opeation
6.5 Toei Animation
6.5.1 Profile
6.5.2 Operation
6.6 Sotsu
6.6.1 Profile
6.6.2 Operation
6.7 Studio Ghibli
7. Typical Enterprises in China's Animation Industry
7.1 ALPHA
7.1.1 Profile
7.1.2 Development Course
7.1.3 Operation
7.1.4 Revenue Structure
7.1.5 Competitive Edge
7.1.6 Cooperation with Hasbro
7.1.7 Comprehensive Development
7.1.8 Performance Forecast
7.2 Talkweb
7.2.1 Profile
7.2.2 Development Course
7.2.3 Operation
7.2.4 Revenue Structure
7.2.5 Animation Business
7.2.6 Gross Margin
7.2.7 Strategy
7.2.8 Performance Forecast
7.3 Toonmax Media
7.3.1 Profile
7.3.2 Operation
7.3.3 Cooperation with BESTV
7.4 Huawei Technology
7.4.1 Profile
7.4.2 Main Products
7.4.3 Operation
7.4.4 Revenue Structure
7.4.5 Gross Margin
7.4.6 R&D Investment
7.4.7 "Animation + Toy" Business Model
7.4.8 Major Clients
7.4.9 Major Projects
7.4.10 Performance Forecast
7.5 GDC
7.5.1 Profile
7.5.2 Development Course
7.5.3 Operation
7.6 Creative Power Entertaining
7.7 Jiang Toon Animation Co., Ltd.
7.7.1 Profile
7.7.2 Operation
7.7.3 Strategy
7.8 Greatdreams
7.8.1 Profile
7.8.2 Development History
7.8.3 Operation
7.9 SKYNET
7.9.1 Profile
7.9.2 Development Course
7.10 CCTV ANIMATION.COM
7.11 Sunchime Cartoon
7.12 Zhongnan Group Cartoon Television
7.13 Sanpu Smart Fox
7.14 Shanmao Cartoon
图:动漫产业链
图:动漫产业经营模式
表:“产业文化化”与“文化产业化”两种模式之特点
表:美国及日本经典动漫形象蕴含的主题
表:经典动漫形象的播出情况
图:动漫产业关联效应
表:发达国家动漫产业扶持政策及效果
图:国外动漫产业扶持方法
表:美国动漫产业发展历程
表:日本动漫产业发展历程
图:日本动漫产业链
表:中国动漫产业的扶持政策
图:2007-2015E中国动漫产业市场规模
表:中国国内六大动漫卫视频道对比
图:2010年中国动漫行业收入结构
图:中国动漫全产业链
图:2000-2011年中国国产动画片产量及增长
图:2007-2012年中国国产动画片市场规模及增长
图:2007-2012年中国动漫电影市场规模及增长
表:2011年中国动画电影票房
图:2007-2011年中国动漫电影占票房比重
图:2008-2011年中国国内票房前五的动漫电影
表:中国部分公司动漫电影上映情况
图:2005-2012年中国网民规模和互联网普及率
图:中国手机网民规模及其占网民比例
图:2010年全球主要国家儿童人均玩具消费支出
图:2000-2012年中国玩具出口额及同比增长
图:2000-2012年中国动漫服装市场规模
表:中国国内主要动漫服饰企业情况
表:2010-2012年中国部分新增筹建的动漫主题公园项目
图:中国动漫产业基地分布
图:动漫产业基地授权机构
表:中国动漫产业基地的三种类型
表:中国动漫产业基地的运作模式
表:迪士尼公司概况
图:2010-2013财年迪斯尼公司营业收入与净利润
图:2010-2012财年迪斯尼公司营业收入与营业利润(分业务)构成
图:2013财年第一季度迪斯尼公司营业收入与营业利润(分业务)构成
表: 2012年迪士尼乐园数量及分布
图:迪士尼品牌价值链
图:迪士尼品牌产业构架
图:迪士尼商业模式
表:万代南梦宫集团发展历程
图:2008-2012财年万代南梦宫集团营业收入与净利润
图:2012财年万代南梦宫集团收入构成
图:2013财年前三季度万代南梦宫集团营业收入与净利润
图:2013财年上半年万代南梦宫集团收入与利润构成
图:万代南梦宫集团未来发展规划
表:1998-2012年梦工厂主要电影票房情况
表:皮克斯介绍
表:皮克斯主要动漫电影票房情况
图:东映动画动漫形象创作流程
图:东映动画全球业务分布
图:2009-2013财年前三季度东映动画主要营业指标
图:2013财年东映动画主要营业指标预测
图:2013财年第一季度Sotsu公司主要营业指标
图:2009-2012财年Sotsu公司收入与利润
表:吉卜力工作室主要动漫作品票房情况
表:2011-2012年奥飞动漫发展历程
图:2009-2012年奥飞动漫营业收入与净利润
表:2010-2012年奥飞动漫主营业务收入(分业务)构成
图:2012年奥飞动漫主营业务收入构成(分业务)
图:2006-2012年奥飞动漫营业收入(分地区)构成
图:2009-2012年奥飞动漫玩具业务毛利率
图:奥飞动漫业务
图:奥飞动漫全产业链
表:2012-2015年奥飞动漫营业收入与净利润及预测
表:拓维信息发展历程
图:2009-2012年拓维信息营业收入与净利润
表:2011-2012年拓维信息营业收入(分产品)构成
图:2010-2012年拓维信息营业收入(分地区)构成
表:中国移动八大基地和拓维信息的合作情况
图:拓维信息文化创意业务发展模式
图:2009-2015年拓维信息毛利率及预测
表:2012年上半年拓维信息毛利率(分产品)
图:拓维信息的转型战略
表:2012-2015年拓维信息营业收入与净利润预测
表:炫动传播公司发展概况
表:炫动传播主营业务运营情况
表:骅威股份主要产品
图:2009-2012年骅威股份营业收入与净利润
图:2009-2012年骅威股份营业收入(分产品)构成
图:2010-2012年骅威股份营业收入(分地区)构成
图:2009-2012年骅威股份主要产品毛利率
表:2009-2012年骅威股份研发费用及占营业收入的比例
图:骅威股份“动漫+玩具”商业模式流程
表:2012年上半年骅威股份前五名客户营业收入及占比
表:骅威股份募集资金项目(截止2012年6月)
表:骅威股份动漫制作项目分析
表:骅威股份营销网络建设项目
表:2012-2015年骅威股份营业收入与净利润预测
图:环球数码组织架构
表:环球数码发展历程
图:2012年前三季度环球数码主要营业指标
图:2010-2011年环球数码主要营业指标
图:2011年环球数码营业收入构成
表:原创动力公司发展概况
表:江通动画公司发展概况
表:宏梦卡通公司发展概况
表:宏梦卡通发展历程
图:2010年宏梦卡通营业收入构成(分业务)
表:天络行发展历程
表:央视动画公司发展概况
表:央视动画有限公司主要动画作品
表:三辰卡通公司发展概况
图:三浦灵狐组织结构
表:山猫卡通发展历程
Industrial Chain of Animation Industry
Business Model of Animation Industry
Characteristics of "Industrial Culturalization" and " Cultural Industrialization"
Themes included in Classic Cartoon Images in America and Japan
Broadcast of Classic Cartoon Images
Correlation Effects of Animation Industry
Support Policy and Influence of Animation Industry in Developed Nations
Support Measures of Overseas Animation Industry
Development History of American Animation Industry
Development History of Japanese Animation Industry
Japanese Animation Industry Chain
Policies Support on China Animation Industry in China
Market Scale of Animation Industry in China, 2007-2015E
Six Animation Satellite TV Channels in China
Revenue Structure of Animation Industry in China, 2010
Complete Industrial Chain of China Animation
Output and Growth Rate of Domestic TV Cartoon in China, 2000-2011
Domestic TV Cartoon Market Scale of Growth Rate in China, 20007-2012
Market Scale and Growth Rate of Animated Films in China, 2007-2012
Box Office of Animated Films in China, 2011
Contribution of Animated Films to Total Box Office in China, 2007-2011
TOP5 Animated Films in China (by Box Office), 2008-2011
Box Office of Some Animated Films in China
Size of Mobile Internet Users and Its Penetration Rate, 2005-2012
Size of Mobile Phone Netizens and Its Proportion in China
Per Capita Consumption Expenditure of Children in Major Countries, 2010
Export Value and YoY Growth Rate of Chinese Toys, 2000-2012
Market Scale of Animation Costume, 2000-2012
Domestic Animation Apparel Enterprises in China
New Animation Theme Parks to be Built in China, 2010-2012
Regional Distribution of Animation Industry Bases
Authority of Animation Industry Base
Types of Animation Industry Bases in China
Operation Mode of China Animation Industry Base
Profile of Disney
Revenue and Net Income of Disney, FY2010-FY2013
Revenue and Operating Income of Disney (by Business), FY2010-FY2012
Revenue and Operating Income of Disney (by Business), FY2013Q1
Quantity and Distribution of Disneyland, 2012
Value Chain of Disney Brand
Industry Structure of Disney Brand
Business Model of Disney
Net Sales and Net Income of Bandai Namco Group, FY2008-FY2012
Net Sales Structure of Bandai Namco Group, FY2012
Revenue and Structure of Bandai Namco Group, FY2013Q1-Q3
Net Sales and Operating Income of Bandai Namco Group, FY2013H1
Development Plan of Bandai Namco Group
Box Office of Animated Films of DreamWorks, 1998-2012
Profile of Pixar Animation
Box Office of Animated Films of Pixar Animation
Production Process of Cartoon Images of Toei Animation
Global Distribution of Toei Animation
Main Operating Indicators of Toei Animation, FY2009-FY2013
Main Operating Indicators of Toei Animation, FY2013
Main Operating Indicators of Sotsu, FY2013Q1
Sales and Profit of Sotsu, FY2009-FY2012
Box Office of Animated Films of Studio Ghibli
Development Course of Alpha Animation, 2011-2012
Revenue and Net Income of Alpha Animation, 2009-2012
Revenue of Alpha Animation (by Business), 2012
Revenue of Alpha Animation (by Region), 2006-2012
Gross Margin of Toy Business of Alpha Animation, 2009-2012
Business of Alpha Animation
Industry Chain of Alpha Animation
Revenue and Net Income of ALPHA, 2012-2015E
Development History of Talkweb
Revenue and Net Income, 2009-2012
Revenue Structure of Talkweb (by Products), 2011-2012
Revenue Structure of Talkweb (by Regions), 2010-2012
Eight Segments Bases of China Mobile and Its Cooperation with Talkweb
Development Mode of Cultural and Creative Business of Talkweb
Gross Margin of Talkweb, 2009-2015E
Gross Margin of Talkweb (by Products), 2012H1
Transition Strategy of Talkweb
Revenue and Net Income of Talkweb, 2012-2015E
Business Operation of Toonmax Media
Major Products of Huawei Technology
Revenue and Net Income of Huawei Technology, 2009-2012
Revenue Structure of Huawei Technology (by Segments), 2009-2012
Revenue Structure of Huawei Technology (by Region), 2010-2012
Gross Margin of Huawei Technology, 2009-2012
R&D Costs and % of Total Revenue of Huawei Technology, 2009-2012
Process of “Animation + Toy” Business Model of Huawei Technology
Huawei Technology’s Revenue from Top 5 Clients and % of Total Revenue, 2012H1
Fund-Raising Projects of Huawei Technology (by June 2012)
Animation Production Projects of Huawei Technology
Marketing Networks Projects of Huawei Technology
Revenue and Net Income of Huawei Technology, 2012-2015E
Organizing Structure of GDC
Development History of GDC
Main Operating Indicators of GDC, 2012Q1-Q3
Main Operating Indicators of GDC, 2010-2011
Revenue Structure of GDC, 2011
Development History of Greatdreams
Revenue Structure of Greatdreams, 2010
Development History of SKYNET
Development Overview of CCTV Animation Co., Ltd
Animated Works of CCTV ANIMATION.COM
Organizing Structure of Sanpu Smart Fox
Development History of Shanmao Cartoon
如果这份报告不能满足您的要求,我们还可以为您定制报告,请 留言说明您的详细需求。
|