|
|
|
报告导航:研究报告—
制造业—材料
|
|
2012-2013年全球及中国氧化铝及电解铝行业研究报告 |
 |
字数:1.4万 |
页数:89 |
图表数:46 |
|
中文电子版:7500元 |
中文纸版:3750元 |
中文(电子+纸)版:8000元 |
|
英文电子版:1950美元 |
英文纸版:2050美元 |
英文(电子+纸)版:2250美元 |
|
编号:CHW002
|
发布日期:2013-04 |
附件:下载 |
 |
|
|
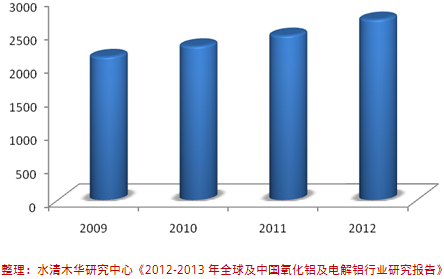
中国铝土矿质量较差,优质铝土矿自给率不足,随着国内新建氧化铝产能的陆续投产和下游冶炼能力的扩大,中国铝土矿进口迅速增加。中国进口的铝土矿主要来自印度尼西亚、澳大利亚、印度,其中印度尼西亚占到70% 以上的份额。 由于中国西部地区电价成本低于东部地区,导致西部地区的电解铝产能不断扩张。同时东部地区高耗能、高成本电解铝产能尚未大规模缩减,造成了2012年中国电解铝行业出现了较严重的产能过剩。与中国类似,全球其他国家也同样出现了产能过剩。 2009-2012年中国电解铝产能(单位:百万吨)
铝土矿成本、动力成本上升和低迷的LME价格导致铝行业出现大面积亏损。为应对成本上升和价格低迷带来的双重压力,国内外企业纷纷整合上游资源和拓展下游产品。此外,俄罗斯铝业联合公司等巨头还计划适量减产,并淘汰落后产能。 《2012-2013年全球及中国氧化铝及电解铝行业研究报告》主要分析全球及中国氧化铝及电解铝供需格局、行业发展趋势,对全球和中国铝行业重要企业的经营业绩、发展规划等进行重点分析。 俄罗斯铝业联合公司(RUSAL)是全球铝行业巨头之一,其产品主要包括原铝、铝合金、铝土矿和氧化铝。俄铝是典型的产业链较全的上游铝产品生产企业,其铝土矿资源可满足自身70%的需求量,与此同时,俄铝还在不断整合上游水电和煤电资源。2012年,俄罗斯铝业联合公司已将原铝产量缩减至 103.8 万吨,此外,公司还计划在2013年前淘汰原铝产能 30 万吨,并将铝加工产品的产量比例提高至39%。 2012年中国铝业加大有成本竞争力的产品产量,其中自有矿山铝土矿产量提高 27.29%,至1726万吨,氧化铝产量提高 8.08% 至 1190 万吨。为整合上游资源,中国铝业与印度尼西亚公司合作开采铝土矿,项目建成后产能可达180万吨。2013年01月中国铝业累积获得宁夏发电70.82% 股权,控股宁夏发电后中铝煤炭产能可达 1600 万吨/年。
China’s bauxite features poor quality and low self-sufficiency rate of
high-quality bauxite. With the gradual release of new alumina capacity
and expansion of downstream smelting capacity in China, China has
rapidly increased the import of bauxite. China’s imports of bauxite
mainly come from Indonesia, Australia and India, among which, Indonesia
accounts for more than 70%. As the electricity cost in western
region is lower than that in the eastern region of China, the
electrolytic aluminum capacity of the western region has continued to
expand, but in the meantime, the high energy-consuming and high-cost
electrolytic aluminum capacity of the eastern region hasn’t been reduced
in large scale, leading to serious overcapacity in China’s electrolytic
aluminum industry in 2012. Other countries also encountered with the problem of overcapacity as China did. China's Electrolytic Aluminum Capacity, 2009-2012 (Unit: Mt)
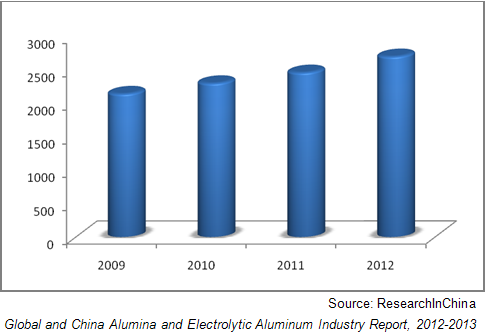
The
rising bauxite and power costs as well as the sluggish LME prices have
led to large-scale losses in the aluminum industry. In order to cope
with the dual pressure from rising costs and sluggish prices, domestic
and foreign enterprises have integrated upstream resources and expanded
downstream products. In addition, giants like RUSAL have planned to cut
the production moderately and eliminate backward production capacity. Global
and China Alumina and Electrolytic Aluminum Industry, 2012-2013 mainly
analyzes the supply & demand and industry development trend of
alumina and electrolytic aluminum in China and worldwide, and sheds
light on the business performance and development planning of key
enterprises in the global and Chinese aluminum industry. As a
giant in the global aluminum industry, RUSAL mainly produces primary
aluminum, aluminum alloy, bauxite and alumina. RUSAL is a typical
producer of upstream aluminum products with a relatively complete
industry chain, and its own bauxite resources can meet 70% of its
demand. Meanwhile, RUSAL continues to integrate upstream hydropower and
thermal power resources. In 2012, RUSAL reduced the output of primary
aluminum to 1.038 million tons, it also plans to eliminate 300 kilotons
of primary aluminum capacity before 2013, and increase the output
proportion of processed aluminum products to 39%. In 2012,
CHALCO increased the output of cost-competitive products, with the
bauxite output of its own mines increased by 27.29% to 17.26 million
tons and the alumina output by 8.08% to 11.9 million tons. To integrate
upstream resources, CHALCO cooperated with an Indonesian company to
exploit bauxite, and the project can achieve an annual capacity of 1.8
million tons upon completion. In January 2013, CHALCO cumulatively
acquired 70.82% stake in Ningxia Electric Power Group, increasing
another 16 million tons of coal production capacity per year.
第一章 全球铝产业链上游产业
1.1 全球铝土矿
1.1.1 铝土矿简介
1.1.2 全球铝土矿资源分布
1.1.3 全球铝土矿生产
1.1.4 全球铝土矿贸易
1.2 全球氧化铝行业
1.2.1 氧化铝供需分析
1.2.2 生产
1.2.3 消费
1.3 全球电解铝行业
1.3.1 生产
1.3.2 消费
第二章 中国铝产业链上游产业
2.1 政策环境
2.1.1 准入政策
2.1.2 发展规划
2.1.3 贸易政策
2.2 产业环境
2.3 中国铝土矿
2.3.1 中国铝土矿储量及分布
2.3.2 中国铝土矿贸易
2.4 中国氧化铝行业
2.4.1 氧化铝供给
2.4.2 区域结构
2.4.3 氧化铝需求
2.5 中国电解铝行业
2.5.1 电解铝供给
2.5.2 区域结构
2.5.3 电解铝需求
第三章 中国氧化铝及电解铝进出口分析
3.1氧化铝
3.1.1 氧化铝进口
3.1.2 区域结构
3.1.3 氧化铝出口
3.2 电解铝
3.2.1 电解铝进口
3.2.2 电解铝出口
第四章氧化铝及电解铝市场价格
4.1 氧化铝
4.1.1 定价模式
4.1.2 价格走势
4.2 电解铝
4.2.1 国际价格
4.2.2 中国价格
第五章 国外铝行业重点企业分析
5.1俄罗斯铝业联合公司
5.1.1 公司简介
5.1.2 经营情况
5.1.3 发展动态
5.2 力拓集团
5.2.1 公司简介
5.2.2 铝土矿储量
5.2.3 经营情况
5.2.4铝业公司经营情况
5.2.5 发展动态
5.2.6 发展战略
5.3美国铝业公司
5.3.1 公司简介
5.3.2 铝土矿储量
5.3.3 经营情况
5.3.4 成本控制
5.3.5 发展动态
5.4挪威海德鲁铝业公司
5.4.1 公司简介
5.4.2 经营情况
5.4.3 发展动态
5.5 必和必拓公司
5.5.1 公司简介
5.5.2 经营情况
5.5.3 铝业公司
5.5.4 铝业公司发展动态
5.6巴林铝业公司
5.6.1 公司简介
5.6.2 经营情况
5.6.3 发展动态
第六章 中国铝行业重点企业分析
6.1 中国铝业(ALUMINUM CORPORATION OF CHINA LIMITED)
6.1.1 企业简介
6.1.2 经营情况
6.1.3 收入结构
6.1.4 毛利率
6.1.5 重大事项
6.1.6 发展战略
6.1.7 经营前景
6.2 中国电力投资集团(CHINA POWER INVESTMENT CORPORATION)
6.2.1 企业简介
6.2.2 经营情况
6.2.3 发展动态
6.3 信发集团(XINFA GROUP)
6.3.1 企业简介
6.3.2 发展动态
6.4 魏桥铝电
6.4.1 企业简介
6.4.2 经营情况
6.4.3 重点工程
6.5 晋北铝业(AHANXI LUNENG JIN BEI ALUMIUM)
6.5.1 企业简介
6.5.2 经营情况
6.5.3 重大事项
6.5.4 发展战略
6.6 开曼铝业(三门峡)(KAIMAN ALUMINUM CO., LTD)
6.6.1 企业简介
6.6.2 经营情况
6.6.3 发展动态
6.7 南山铝业(SHANDONG NANSHAN ALUMINUM CO.,LTD)
6.7.1 企业简介
6.7.2 经营情况
6.7.3 收入结构
6.7.4 毛利率
6.7.5 发展动态
6.7.6 经营前景
6.8 博赛集团(BOSAI MINERALS GROUP CO., LTD)
6.8.1 企业简介
6.8.2 经营情况
6.8.3 发展动态
6.8.4 发展战略
6.9 云铝股份(YUNNAN ALUMINIUM CO. LTD)
6.9.1 企业简介
6.9.2 经营情况
6.9.3 收入结构
6.9.4 毛利率
6.9.5 发展前景
6.9.6 发展战略
6.10 中达铝业
6.10.1 企业简介
6.10.2 经营情况
6.11 其他企业
6.11.1 东方希望(三门峡)铝业有限公司
6.11.2 广西华银铝业有限公司(Guangxi Huayin Aluminium Co.,Ltd)
6.11.3 龙口东海氧化铝有限公司
6.11.4 洛阳香江万基铝业有限公司
6.11.5 三门峡义翔铝业有限公司
1 Upstream of Global Aluminum Industry Chain
1.1 Status Quo of Bauxite in the World
1.1.1 Overview
1.1.2 Bauxite Reserves & Distribution
1.1.3 Production
1.1.4 Global Trade of Bauxite
1.2 Global Alumina Industry
1.2.1 Supply & Demand
1.2.2 Production
1.2.3 Consumption
1.3 Global Electrolytic Aluminum Industry
1.3.1 Production
1.3.2 Consumption
2 Upstream of China’s Aluminum Industry Chain
2.1 Policy Environment
2.1.1 Access Policy
2.1.2 Development Plan
2.1.3 Trade Policy
2.2 Industry Environment
2.3 China’s Bauxite Industry
2.3.1 Bauxite Reserves and Distribution in China
2.3.2 Bauxite Trade in China
2.4 China’s Alumina Industry
2.4.1 Supply
2.4.2 Regional Structure
2.4.3 Demand
2.5 China’s Electrolytic Aluminum Industry
2.5.1 Supply
2.5.2 Regional Structure
2.5.3 Demand
3 Import and Export of Alumina and Electrolytic Aluminum in China
3.1 Alumina
3.1.1 Import
3.1.2 Regional Structure
3.1.3 Export
3.2 Electrolytic Aluminum
3.2.1 Import
3.2.2 Export
4 Alumina and Electrolytic Aluminum Prices
4.1 Alumina
4.1.1 Pricing Model
4.1.2 Price Trend
4.2 Electrolytic Aluminum
4.2.1 Global Price
4.2.2 Domestic Price
5 Foreign Enterprises
5.1 RUSAL
5.1.1 Profile
5.1.2 Operation
5.1.3 Dynamics
5.2 Rio Tinto
5.2.1 Profile
5.2.2 Bauxite Reserves
5.2.3 Operation
5.2.4 Aluminum Group
5.2.5 Dynamics
5.2.6 Outlook and Strategy
5.3 ALCOA
5.3.1 Profile
5.3.2 Bauxite Reserves
5.3.3 Operation
5.3.4 Cost Control
5.3.5 Dynamics
5.4 HYDRO
5.4.1 Profile
5.4.2 Operation
5.4.3 Dynamics
5.5 BHP Billiton
5.5.1 Profile
5.5.2 Operation
5.5.3 Aluminum CSG
5.5.4 Dynamics of Aluminum CSG
5.6 Alba
5.6.1 Profile
5.6.2 Operation
5.6.3 Dynamics
6 China’s Enterprises
6.1 Aluminum Corporation of China Limited
6.1.1 Profile
6.1.2 Operation
6.1.3 Revenue Structure
6.1.4 Gross Margin
6.1.5 Major Event
6.1.6 Development Strategy
6.1.7 Operation Forecast
6.2 China Power Investment Corporation
6.2.1 Profile
6.2.2 Operation
6.2.3 Development
6.3 Xinfa Group
6.3.1 Profile
6.3.2 Dynamics
6.4 Shandong Weiqiao Aluminum & Electricity
6.4.1 Profile
6.4.2 Operation
6.4.3 Key Project
6.5 Shanxi Luneng Jin Bei Aluminum
6.5.1 Profile
6.5.2 Operation
6.5.3 Major Event
6.5.4 Development Strategy
6.6 Kaiman Aluminum Co., Ltd.
6.6.1 Profile
6.6.2 Operation
6.6.3 Dynamics
6.7 Shandong Nanshan Aluminum Co., Ltd.
6.7.1 Profile
6.7.2 Operation
6.7.3 Revenue Structure
6.7.4 Gross Margin
6.7.5 Development
6.7.6 Operation Forecast
6.8 Bosai Minerals Group Co., Ltd.
6.8.1 Profile
6.8.2 Operation
6.8.3 Development
6.8.4 Development Plan
6.9 Yunnan Aluminum Co., Ltd.
6.9.1 Profile
6.9.2 Operation
6.9.3 Revenue Structure
6.9.4 Gross Margin
6.9.5 Operation Forecast
6.9.6 Development Strategy
6.10 Shanxi ZhongDa Corporation
6.10.1 Profile
6.10.2 Operation
6.11 Other Enterprises
6.11.1 East Hope (Sanmenxia)
6.11.2 Guangxi Huayin Aluminum Co., Ltd.
6.11.3 Longkou Donghai Alumina
6.11.4 Luoyang Heung Kong Wanji Aluminum
6.11.5 Sanmenxia Yixiang Aluminum
图:2012年全球铝土矿资源分布
图:2012年全球铝土矿产量分布
图:2008-2012年全球氧化铝产量(单位:百万吨)
图:2007-2012年全球氧化铝消费量(单位:百万吨)
图:2008-2012年全球电解铝产量(单位:万吨)
图:2009-2012年全球电解铝需求量(单位:万吨)
表:2013年铝相关产品进口关税表
表:2013年铝相关产品出口关税表
图:2011年中国铝土矿储量排名前10省市(单位:万吨)
图:2008-2012年中国铝土矿进口量(单位:百万吨)
图:2008-2012年中国铝土矿进口量(分来源国)构成(单位:百万吨)
图:2006-2012年中国铝土矿平均进口价格(单位:美元/吨)
图:2009-2012年中国氧化铝建成产能(单位:百万吨)
图:2007-2012年中国氧化铝产量(单位:百万吨)
表:2012年中国氧化铝产能地区分布(单位:万吨)
图:2008-2012年中国氧化铝表观消费量(单位:百万吨)
图:2009-2012年中国电解铝建成产能(单位:百万吨)
图:2008-2012年中国电解铝产量(单位:万吨)
表:2012年中国氧化铝产能地区分布(单位:万吨)
图:2008-2012年中国电解铝表观消费量(单位:万吨)
图:2009-2012年中国氧化铝进口量和进口均价(单位:千吨;美元/吨)
图:2012年中国氧化铝分地区进口比例
图:2009-2012年中国氧化铝出口量和出口均价(单位:吨;美元/吨)
图:2009-2012年中国电解铝进口量(单位:吨)
图:2009-2012年中国未锻轧非合金铝出口量(单位:吨)
图:2007-2013年中国氧化铝现货价格(单位:元/吨)
图:2004-2013年中铝氧化铝现货价格(单位:元/吨)
图:2011-2013伦敦期货交易所铝价格
图:2011-2013上海期货交易所铝价格
图:2009-2012年俄罗斯铝业联合公司营业收入和净利润(单位:百万美元)
图:2009-2012年俄铝分产品收入(单位:百万美元)
表:2011-2012年俄铝分地区收入
表:2011-2012年力拓铝土矿储量(单位:百万吨)
表:2010-2012 年力拓主要财务指标(单位:百万美元)
表:2011-2012年力拓铝业集团主要财务指标(单位:百万美元)
表:2010-2012年力拓分产品毛利率
表:2012年美国铝业铝土矿权益及产量
图:2010-2012年美国铝业分公司净利润(单位:百万美元)
表:2010-2012年美国铝业分产品收入(单位:百万美元)
表:2010-2012年美国铝业分地区收入,(单位:百万美元)
表:2012年美国铝业自有电厂发电容量
图:2012年挪威海德鲁分地区收入
表:2011-2012年海德鲁主要财务指标
表:2011-2012年海德鲁分产品产量
表:2010-2012年必和必拓主要财务指标
表:2010-2012年必和必拓分产品收入
表:2010-2012年必和必拓铝业公司产品产量(单位:千吨)
表:2011年必和必拓铝业公司铝土矿储量
表:2011-2012年巴林铝业公司主要财务指标(单位:百万美元)
图:2009-2012年中国铝业营业收入及净利润(单位:百万人民币)
图:2005-2012年中国铝业氧化铝市场份额
表:2009-2012年中国铝业分产品收入(单位:百万人民币)
表:2009-2012年中国铝业分地区收入(单位:百万人民币)
表:2009-2012年中国铝业主要产品毛利率
表:2012-2014年中国铝业营业收入及净利润预测(单位:百万人民币)
表:信发集团子公司及主营业务
图:南山铝业产业链
图:2009-2012年南山铝业营业收入及净利润(单位:百万人民币)
图:2009-2012年南山铝业分产品收入(单位:百万人民币)
表:2009-2012年南山铝业分地区收入(单位:百万人民币)
表:2009-2012年南山铝业主要产品毛利率
表:2012-2014年南山铝业营业收入及净利润预测(单位:百万人民币)
图:2000-2011年博赛集团销售收入(单位:人民币百万元)
图:2009-2012年云南铝业营业收入及净利润
表:2009-2012年云南铝业分产品收入(单位:百万人民币)
表:2009-2012年云南铝业分地区收入(单位:百万人民币)
表:2009-2012年云南铝业主要产品毛利率
表:2012-2014年云南铝业营业收入及净利润预测(单位:百万人民币)
图:中达铝业销售分布图
Global Distribution of Bauxite Reserves, 2012
Global Distribution of Bauxite Output, 2012
Global Output of Alumina, 2008-2012
Global Consumption of Alumina, 2007-2012
Global Electrolytic Aluminum Output, 2008-2012
Global Demand for Electrolytic Aluminum, 2009-2012
Import Tariffs on Aluminum Related Products, 2013
Export Tariffs on Aluminum Related Products, 2013
Top 10 Chinese Provinces/Municipalities by Bauxite Reserves, 2011
China’s Bauxite Import Volume, 2008-2012
China’s Bauxite Import Volume Structure by Country, 2008-2012
Average Import Price of Bauxite in China, 2006-2012
China’s Alumina Capacity, 2009-2012
China’s Alumina Output, 2007-2012
China’s Alumina Output by Region, 2012
China’s Apparent Consumption of Alumina, 2008-2012
China’s Electrolytic Aluminum Capacity, 2009-2012
China’s Electrolytic Aluminum Output, 2008-2012
China’s Alumina Capacity by Region, 2012
China’s Apparent Consumption of Electrolytic Aluminum, 2008-2012
China’s Alumina Import Volume and Average Price, 2009-2012
China’s Alumina Import Structure by Region, 2012
China’s Alumina Export Volume and Average Price, 2009-2012
China’s Electrolytic Aluminum Import Volume, 2009-2012
China’s Export Volume of Unwrought and Non-alloyed Aluminum, 2009-2012
Alumina Spot Price in China, 2007-2013
CHINALCO Alumina Spot Price, 2004-2013
LME Price, 2011-2013
SHFE Price, 2011-2013
Revenue and Net Income of RUSAL, 2009-2012
Revenue of RUSAL by Product, 2009-2012
Revenue of RUSAL by Region, 2011-2012
Bauxite Reserves of Rio Tinto, 2011-2012
Key Financial Indicators of Rio Tinto, 2010-2012
Key Financial Indicators of Aluminum Group of Rio Tinto, 2011-2012
Gross Margin of Rio Tinto by Product, 2010-2012
Bauxite Equity and Output of Alcoa, 2012
Revenue and Net Income of Alcoa by Subsidiary, 2010-2012
Revenue of Alcoa by Product, 2010-2012
Revenue of Alcoa by Region, 2010-2012
Electricity Generation Capacity of Alcoa’s Own Power Plants, 2012
Revenue of Hydro by Region, 2012
Key Financial Indicators of Hydro, 2011-2012
Hydro’s Output by Product, 2011-2012
Key Financial Indicators of BHP Billiton, 2010-2012
Revenue of BHP Billiton by Product, 2010-2012
Output of Aluminum CSG of BHP Billiton, 2010-2012
Bauxite Reserves of Aluminum CSG of BHP Billiton, 2011
Key Financial Indicators of Alba, 2011-2012
Revenue and Net Income of Chalco, 2009-2012
Alumina Market Share of Chalco, 2005-2012
Revenue of Chalco by Product, 2009-2012
Revenue of Chalco by Region, 2009-2012
Gross Margin of Chalco by Product, 2009-2012
Revenue and Net Income of Chalco, 2012-2014
Subsidiaries and Main Businesses of Xinfa
Industrial Chain of Shandong Nanshan Aluminum
Revenue and Net Income of Shandong Nanshan Aluminum, 2009-2012
Revenue of Shandong Nanshan Aluminum by Product, 2009-2012
Revenue of Shandong Nanshan Aluminum by Region, 2009-2012
Gross Margin of Shandong Nanshan Aluminum by Product, 2009-2012
Revenue and Net Income of Shandong Nanshan Aluminum, 2012-2014
Sales of Bosai, 2000-2011
Revenue and Net Income of Yunnan Aluminum, 2009-2012
Revenue of Yunnan Aluminum by Product, 2009-2012
Revenue of Yunnan Aluminum by Region, 2009-2012
Gross Margin of Yunnan Aluminum by Product, 2009-2012
Revenue and Net Income of Yunnan Aluminum, 2012-2014E
Sales Areas of Shanxi ZhongDa Corporation
如果这份报告不能满足您的要求,我们还可以为您定制报告,请 留言说明您的详细需求。
|