|
|
|
报告导航:研究报告—
TMT产业—TMT其他
|
|
2014年全球及中国动漫行业研究报告 |
 |
字数:4.8万 |
页数:135 |
图表数:156 |
|
中文电子版:8500元 |
中文纸版:4250元 |
中文(电子+纸)版:9000元 |
|
英文电子版:2400美元 |
英文纸版:2600美元 |
英文(电子+纸)版:2700美元 |
|
编号:LMX052
|
发布日期:2014-06 |
附件:下载 |
 |
|
|
2013年,中国动漫行业产值继续保持增长,突破900亿元,同比增长约21.0%。尽管行业整体维持增长,但产业链各环节发展程度不尽相同。
从制作和播映市场来看,中国动画片产量连续3年(2011-2013年)下滑。2013年,中国制作完成的国产电视动画片共358部,共204732分钟,分别同比下滑9.37%和8.17%。主要是由于制作成本走高,政府补贴难以覆盖成本,导致产量下滑。另外,原创IP资源稀缺,也是国产动画一直以来难以突破的瓶颈。
作为动漫的另一个主要播放阵地,2011年以来,中国动画电影市场呈现量价齐升的发展态势。2013年,中国内地院线共上映33部动画电影,国产动画电影24部,进口动画电影9部。全年动画电影总票房约为16.4亿元,同比增长13.34%。
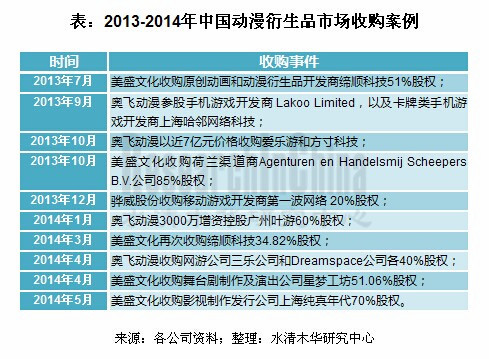
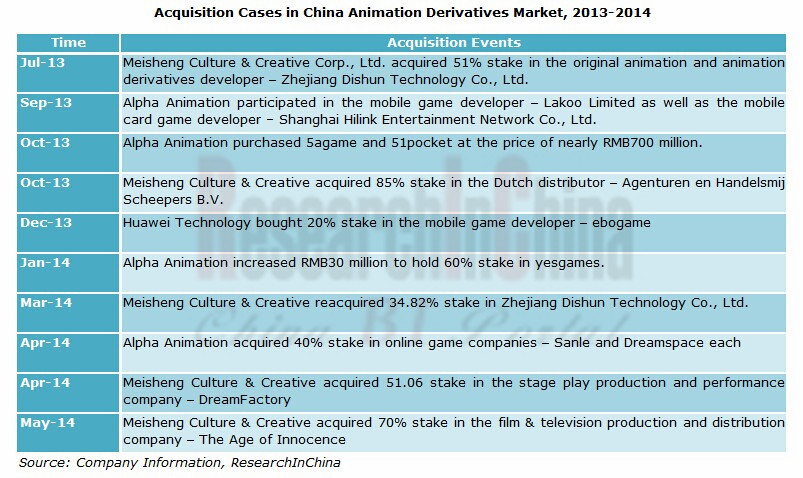
从动漫衍生品市场来看,2013年,其国内市场规模约264亿元,同比增长20%。作为目前中国动漫产业链的核心,2013年以来,衍生品市场并购风波不断,促使动漫产业链条不断完善和延伸。代表企业是奥飞动漫、骅威股份及美盛文化。
其中,作为拥有完整动漫产业链条的龙头企业,奥飞动漫2013年以来主要通过布局网络游戏和移动终端游戏领域,不断延伸其产业链条。2014年一季度,公司实现营业收入3.75亿元,同比增长18.15%;净利润4980万元,同比增长10.28%。
以玩具出口为主业的骅威股份,受出口市场低迷影响,公司2013年净利润大幅下滑25.64%。2013年12月公司收购第一波网络20%股权,业绩有所改善。2014年第一季度,公司营业收入6010万元,净利润360万元,分别同比增长10.28%和0.82%。
以动漫服饰为主业上市的美盛文化2013年以来并购频繁,实现了从内容端(缔顺科技)、媒体端(星梦工坊+上海纯真年代)、到衍生品销售端(荷兰渠道商)的全面贯通。2014年一季度,公司营业收入5070万元,净利润400万元,分别大幅增长218.76%和37.36%。
《2014年全球及中国动漫行业研究报告》主要包含以下几个方面内容:
 全球动漫产业发展概况,主要包括扶持政策、产业格局、主要动漫产业基地美国和日本的动漫产业发展模式及盈利模式; 全球动漫产业发展概况,主要包括扶持政策、产业格局、主要动漫产业基地美国和日本的动漫产业发展模式及盈利模式;
中国动漫产业整体概况,包括政策扶持、行业产值、企业类型、竞争格局等;
中国动漫制作和传播发行市场分析,主要针对电视动画、动画电影、动漫游戏、漫画、新媒体市场、动漫产业基地进行分析及研究;
中国动漫衍生产业分析,包括动漫玩具、动漫服饰、主题公园等衍生产业的行业发展状况;
8家跨国企业及13家中国动漫企业分析,包括公司经营状况,主要动漫作品,经营模式、发展战略及业绩预测等。
China’s animation industry output value continued to grow and exceeded RMB90 billion in 2013, showing a year-on-year increase of around 21.0%. Despite the overall sustained growth, each link of the industrial chain is developing to varying degrees.
From the production and broadcast market, China’s animation production suffered three consecutive years of decline (2011-2013). In 2013 China produced 358 domestic TV cartoons, a total of 204,732 minutes long, respectively down 9.37% and 8.17% year on year, mainly because it was difficult for government subsidiaries to cover the increasingly higher costs of production. In addition, the original IP resource scarcity has been a tough and unbreakable bottleneck for domestic animation.
As another major play position for animation, the Chinese animation film market has shown a rising trend in both quantity and price since 2011. In 2013, there were a total of 33 animation films released in Chinese mainland theatres, including 24 homemade and 9 imported, generating total box office of about RMB1.64 billion, up 13.34% year on year.
With respect to the animation derivatives market, in 2013 the domestic market size approximated RMB26.4 billion, up 20% year on year. As the core of China’s animation industry chain, the derivatives market has encountered stormy mergers and acquisitions since 2013, thus constantly improving and extending the animation industry chain. Representative firms are Guangdong Alpha Animation and Culture Co., Ltd. (Alpha Animation), Huawei Technology Co.,Ltd and Meisheng Culture & Creative Corp., Ltd.
Of which, Alpha Animation as the leader with a complete animation industry chain has continuously extended its industrial chain through the layout of online game and mobile game since 2013. In the first quarter of 2014, it gained revenue of RMB375 million (up 18.15% YoY) and net income of RMB49.8 million (up 10.28% YoY).
The toy export-oriented Huawei Technology Co.,Ltd suffered a sharp decline of 25.64% in net income in 2013, affected by the export market downturn. The performance got improved by acquiring 20% stake in ebogame in December 2012. In the first quarter of 2014, its revenue and net income climbed 10.28% and 0.82% year on year to RMB60.1 million and RMB3.6 million, respectively.
Meisheng Culture & Creative Corp., Ltd., has focusing on anime apparel, but seeing frequent mergers and acquisitions since its listing in 2013, thus realizing the full cut-through from content (Zhejiang Dishun Technology Co., Ltd.), media (DreamFactory + The Age of Innocence) to derivatives sales (the Dutch distributor). In the first quarter of 2014, its revenue and net income saw substantial increases of 218.76% and 37.36% to RMB50.7 million and RMB4 million, respectively.
Global and China Animation Industry Report, 2014 by ResearchInChina mainly covers the followings:
 Overview of global animation industry, mainly involving supportive policies, industrial pattern, as well as development model and profit model of U.S. and Japanese animation industries; Overview of global animation industry, mainly involving supportive policies, industrial pattern, as well as development model and profit model of U.S. and Japanese animation industries;
Overview of Chinese animation industry, including supportive policies, output value, company type, competition patter, etc.;
Chinese animation production and distribution markets, mainly aimed at television animation, animation film, cartoon game, caricature, new media market and animation industry base;
Chinese animation derivatives industries, involving cartoon toys, anime apparel, theme park, etc.;
Operation, anime works, business model, development strategy, performance forecast of eight transnational companies and 13 Chinese animation companies.
前言
第一章 动漫行业的基本介绍
1.1 基本概念
1.2 产业链
1.3 经营模式
1.4 经济特性
1.5 发展特点
第二章 全球动漫行业发展概况
2.1 整体发展
2.1.1 扶持政策
2.1.2 市场格局
2.2 美国
2.2.1 产业概况
2.2.2 发展历程
2.3 日本
2.3.1 产业概况
2.3.2 发展历程
2.3.3 产业链及盈利模式
2.3.4 漫画作品分析
第三章 中国动漫行业发展概况
3.1 政策扶持
3.2 行业产值
3.3 动漫企业分析
3.3.1 主要参与者
3.3.2 制作型公司
3.3.3 媒体型公司
3.3.4 整合运营型公司
3.3.5 总结
3.4 竞争格局
3.4.1 海外企业在华布局
3.4.2 企业IP资源
第四章 中国动漫制作和传播发行市场
4.1 电视动画
4.2 动漫电影
4.3 动漫游戏
4.4 漫画
4.5 新媒体市场
4.6 动漫产业基地
4.6.1 产业基地概述
4.6.2 运作模式
第五章 中国动漫衍生产业分析
5.1 整体概述
5.2 动漫玩具
5.3 动漫服饰
5.4 主题公园
第六章 国外动漫行业重点企业分析
6.1 Disney
6.1.1 公司简介
6.1.2 发展历程
6.1.3 经营状况
6.1.4 业务模式
6.1.5 竞争优势
6.2 Bandai Namco Group
6.2.1 公司简介
6.2.2 发展历程
6.2.3 经营状况
6.2.4 业绩预测
6.2.5 发展战略
6.3 Hasbro
6.3.1 公司简介
6.3.2 发展历程
6.3.3 品牌介绍
6.3.4 经营状况
6.3.5 发展战略
6.4 DreamWorks
6.4.1 Profile
6.4.2 Operation
6.5 Pixar Animation
6.5.1 Profile
6.5.2 Development History
6.5.3 Operation
6.6 Toei Animation
6.6.1 公司简介
6.6.2 发展历程
6.6.3 经营状况
6.7 Sotsu
6.7.1 公司简介
6.7.2 发展历程
6.7.3 经营状况
6.8 吉卜力工作室
第七章 中国动漫行业重点分析
7.1 奥飞动漫
7.1.1 公司简介
7.1.2 发展历程
7.1.3 经营状况
7.1.4 营收构成
7.1.5 毛利率
7.1.6 研发投入
7.1.7 竞争优势
7.1.8 战略布局
7.1.9 业绩预测
7.2 环球数码
7.2.1 公司简介
7.2.2 发展历程
7.2.3 经营状况
7.3 华强文化
7.3.1 公司简介
7.3.2 业务介绍
7.3.3 发展战略
7.4 淘米公司
7.4.1 公司简介
7.4.2 发展历程
7.4.3 经营状况
7.4.4 合作伙伴
7.4.5 优势及劣势
7.5 炫动传播
7.5.1 公司简介
7.5.2 业务介绍
7.5.3 优势及劣势
7.6 原创动力
7.7 杭州玄机科技
7.7.1 公司简介
7.7.2 经营状况
7.8 青青树动漫
7.9 卡酷传媒
7.9.1 公司简介
7.9.2 业务介绍
7.10 三辰卡通
7.11 央视动画
7.12 骅威股份
7.12.1 公司简介
7.12.2 主要产品
7.12.3 经营状况
7.12.4 营收构成
7.12.5 毛利率
7.12.6 客户及供应商
7.12.7 研发投入及主要项目
7.12.8 进军移动游戏产业
7.12.9 竞争优势
7.12.10 业绩预测
7.13美盛文化
7.13.1 公司简介
7.13.2 发展历程
7.13.3 产品介绍
7.13.4 经营状况
7.17.5 营收构成
7.13.6 毛利率
7.13.7 战略布局
7.13.8 业绩预测
第八章 市场总结与发展预测
8.1 市场总结
8.1.1 产业发展环境
8.1.2 产业链发展现状
8.2 发展预测
8.2.1 驱动因素
8.2.2 行业产值预测
Preface
1. Overview of Animation Industry
1.1 Definition
1.2 Industrial Chain
1.3 Business Model
1.4 Economic Characteristics
1.5 Development Features
2. Global Animation Industry Development
2.1 Overview
2.1.1 Support Policy
2.1.2 Market Pattern
2.2 United States
2.2.1 Overview
2.2.2 Development History
2.3 Japan
2.3.1 Overview
2.3.2 Development History
2.3.3 Industrial Chain and Profit Model
2.3.4 Animation Products Analysis
3. China Animation Industry Development
3.1 Policy Support
3.2 Output Value
3.3 Enterprises Analysis
3.3.1 Major Participants
3.3.2 Production Type
3.3.3 Media Type
3.3.4 Integrated Type
3.3.5 Summary
3.4 Competition Pattern
3.4.1 Foreign Enterprises’ Layout in China
3.4.2 Enterprises’ IP Resources
4. Animation Production and Distribution Markets in China
4.1 TV Animation
4.2 Animated Film
4.3 Cartoon Game
4.4 Comic
4.5 New Media Market
4.6 Animation Industry Base
4.6.1 Overview
4.6.2 Operation Model
5. China Animation Derivative Industry
5.1 Overview
5.2 Animation Toy
5.3 Animation Apparel
5.4 Theme Park
6. Typical Enterprises in Global Animation Industry
6.1 Disney
6.1.1 Profile
6.1.2 Development History
6.1.3 Operation
6.1.4 Business Model
6.1.5 Competitive Advantages
6.2 Bandai Namco Group
6.2.1 Profile
6.2.2 Development History
6.2.3 Operation
6.2.4 Performance Forecast
6.2.5 Development Strategy
6.3 Hasbro
6.3.1 Profile
6.3.2 Development History
6.3.3 Brands
6.3.4 Operation
6.3.5 Strategy
6.4 DreamWorks
6.4.1 Profile
6.4.2 Operation
6.5 Pixar Animation
6.5.1 Profile
6.5.2 Development History
6.5.3 Operation
6.6 Toei Animation
6.6.1 Profile
6.6.2 Development History
6.6.3 Operation
6.7 Sotsu
6.7.1 Profile
6.7.2 Development History
6.7.3 Operation
6.8 Studio Ghibli
7. Typical Enterprises in China's Animation Industry
7.1 Guangdong Alpha Animation And Culture Co., Ltd.
7.1.1 Profile
7.1.2 Development History
7.1.3 Operation
7.1.4 Revenue Structure
7.1.5 Gross Margin
7.1.6 R & D Expense
7.1.7 Competitive Advantages
7.1.8 Strategic Layout
7.1.9 Performance Forecast
7.2 Global Digital Creations Holdings Limited
7.2.1 Profile
7.2.2 Development History
7.2.3 Operation
7.3 Fantawild Holdings Inc.
7.3.1 Profile
7.3.2 Business
7.3.3 Strategy
7.4 Taomee Holdings Limited
7.4.1 Profile
7.4.2 Development History
7.4.3 Operation
7.4.4 Partners
7.4.5 Advantages and Disadvantages
7.5 Toonmax Media Co., Ltd.
7.5.1 Profile
7.5.2 Business
7.5.3 Advantages and Disadvantages
7.6 Guangdong Creative Power Entertaining Co., Ltd.
7.7 Sparkly Key Animation Studio
7.7.1 Profile
7.7.2 Operation
7.8 Vasoon Animation
7.9 KAKU Media Inc.
7.9.1 Profile
7.9.2 Business Introduction
7.10 Sunchime Cartoon
7.11 CCTV ANIMATION.COM
7.12 Huawei Technology Co., Ltd
7.12.1 Profile
7.12.2 Products
7.12.3 Operation
7.12.4 Revenue Structure
7.12.5 Gross Margin
7.12.6 Clients and Suppliers
7.12.7 R & D Expense and Projects
7.12.8 Entering into Mobile Game Industry
7.12.9 Competitive Advantages
7.12.10 Performance Forecast
7.13 Meisheng Cultural & Creative Corp., Ltd.
7.13.1 Profile
7.13.2 Development Course
7.13.3 Products
7.13.4 Operation
7.13.5 Revenue Structure
7.13.6 Gross Margin
7.13.7 Strategic Layout
7.13.8 Performance Forecast
8. Market Overview and Development Forecast
8.1 Market Overview
8.1.1 Development Environment
8.1.2 Status of Industrial Chain
8.2 Development Forecast
8.2.1 Drivers
8.2.2 Output Value Forecast
图:动漫产业链
图:动漫产业经营模式
表:“产业文化化”与“文化产业化”两种模式之特点
表:美国及日本经典动漫形象蕴含的主题
表:经典动漫形象的播出情况
图:动漫产业关联效应
表:发达国家动漫产业扶持政策及效果
图:国外动漫产业扶持方法
图:全球动漫产业三大梯队
表:主要国家动漫产业发展对比
表:美国动漫产业发展历程
表:日本动漫产业发展历程
图:日本动漫产业链
表:2013年日本漫画市场畅销榜TOP5
表:中国动漫产业的扶持政策
图:2009-2013年中国动漫产业总值及同比增速
图:动漫产业参与者
表:中国动漫产业链主要代表公司
表:2007-2013年中国国内市场主要动漫形象及出品公司
表:中国国内六大动漫卫视频道对比
表:中国动漫衍生品主要上市公司介绍
表:2013-2014年中国主要动漫衍生品企业营业收入与净利润
表:2013-2014年中国主要动漫衍生品企业营业收入与净利润增长
表:海外动漫企业在华布局
图:2012年中国动漫内容消费市场结构
表:孩之宝IP品牌积累
图:奥飞动漫品牌
表:中国动漫产业链公司IP数量对比
图:2007-2013年中国国产动画片数量
图:2007-2013年中国国产动画片时长
表:2013年中国各省国产电视动画片生产情况
图:2009-2013年中国动画电影数量
图:2008-2013年中国动画电影市场票房收入
图:2009-2013年中国国产动画电影票房收入占动画电影总票房收入的比例
图:2011-2017年中国网络游戏市场规模及预测
图:2011-2017年中国网络游戏市场规模结构及预测
表:2013年日本和中国手机动漫市场对比
表 : 中国三大电信运营商动漫业务
表:2013年中国新媒体动漫形象TOP10
表:2012年国家动漫产业基地国产电视动画片生产情况
表:中国动漫产业基地的三种类型
表:中国动漫产业基地的运作模式
图:2013年中国动漫衍生品市场结构
图:2007-2013年中国动漫玩具市场规模
图:2012年世界玩具规模及人均消费
图:2007-2013年中国动漫服饰市场规模
表:中国国内主要动漫服饰企业情况
图:全球迪士尼乐园分布
图:深圳华强集团主题公园系列
表:迪士尼公司概况
表:Disney发展历程
图:2010-2014财年Disney营业收入与净利润
图:2011-2013财年Disney营业收入和营业利润(分业务)构成
图:2013-2014财年上半年Disney营业收入和营业利润(分业务)构成
图:Disney品牌价值链
图:Disney品牌产业结构
图:Disney业务模式
表:Bandai Namco Group发展阶段
表:Bandai Namco Group大事件
图:2011-2014财年 BANDAI NAMCO Holdings Inc.主要财务指标
图:2013-2014财年 BANDAI NAMCO Holdings Inc.营业收入和营业利润(分业务)构成
图:2013-2014财年 BANDAI NAMCO Holdings Inc.营业收入和营业利润(分区域)构成
图:2015财年Bandai Namco Holdings Inc.主要财务指标预测
图:2015财年Bandai Namco Holdings Inc.营业收入和营业利润(分业务)构成
图:2015财年Bandai Namco Holdings Inc.营业收入和营业利润(分区域)构成
图:Bandai Namco Holdings Inc.未来投资规划
图:Bandai Namco Holdings Inc.中长期发展规划
图:孩之宝业务产业链
表:孩之宝发展历程
图:孩之宝品牌发展阶段
图:孩之宝品牌介绍
图:2003-2013年孩之宝营业收入
图:2013Q1和2014Q1孩之宝营业收入
图:2003-2013年孩之宝毛利率
图:2010-2013年孩之宝营业收入(分区域)构成
图:2013Q1和2014Q1孩之宝营业收入(分区域)构成
图:2010-2013年孩之宝营业收入(分产品)构成
图:2013Q1和2014Q1孩之宝营业收入(分产品)构成
图:孩之宝品牌化规划
图:2014年孩之宝重点推广品牌
表:1998-2014年梦工厂主要电影票房情况
表:Pixar Animation Studios发展历程
表:皮克斯主要动漫电影票房情况
图:Toei Animation基本信息
表:Toei Animation发展历程
图:东映动画动漫形象创作流程
图:Toei Animation业务介绍
图:东映动画全球业务分布
图:2010-2014财年Toei Animation主要财务指标
表:Sotsu发展历程
图:2010-2014财年Sotsu营业收入与净利润
表:吉卜力工作室主要动漫作品票房情况
表:2011-2014年奥飞动漫发展历程
图:2009-2014年奥飞动漫营业收入与净利润
表:2010-2013年奥飞动漫营业收入(分业务)构成
图:2006-2013年奥飞动漫营业收入(分区域)构成
表:2010-2013年奥飞动漫毛利率(分业务)
表:2011-2013年奥飞动漫研发投入及占营业收入的比例
图:奥飞动漫全产业链
图:奥飞动漫移动终端业务发展方向
图:嘉佳卡通地域覆盖
图:奥飞动漫媒体宣传和发行渠道
图:奥飞动漫国际化发展战略
图:奥飞动漫与“孩之宝”合作
图:奥飞动漫与迪士尼合作
表:2014-2016年奥飞动漫营业收入与净利润预测
图:环球数码组织架构
表:环球数码发展历程
图:2009-2013年环球数码主要财务指标
图:2013-2014年环球数码主要财务指标
图:2013年环球数码营业收入(分业务)构成
图:2013年环球数码营业收入(分区域)构成
图:华强文化产业基地
图:华强文化国内主题公园分布
表:华强文化文化内容产品及服务介绍
图:华强文化发展规划
表:淘米公司发展历程
图:2012-2014年淘米公司主要财务指标
图:淘米公司主要合作伙伴
图:炫动传播业务架构
表:炫动传播主营业务介绍
图:炫动传播合作伙伴
表:原创动力公司发展概况
表:杭州玄机科技信息技术有限公司介绍
表:青青树动漫主要作品
图:卡酷传媒运营指标
图:卡酷传媒业务
图:苏州卡酷影视业务介绍
图:卡酷全景界业务产业链
图:卡酷传媒主要合作伙伴
表:三辰卡通公司发展概况
表:央视动画公司发展概况
表:央视动画有限公司主要动画作品
表:骅威股份主要产品
图:2009-2014年骅威股份营业收入与净利润
图:2009-2013年骅威股份营业收入(分产品)构成
图:2010-2013年骅威股份营业收入(分区域)构成
表:2009-2013年骅威股份毛利率(分产品)
表:2013年骅威股份TOP5客户收入及占营业收入的比例
表:2013年骅威股份TOP5供应商及占采购总额的比例
表:2009-2013年骅威股份研发费用及占营业收入的比例
表:第一波核心IP改编成的游戏情况
表:2014-2016年骅威股份营业收入与净利润预测
表:美盛文化发展历程
表:美盛文化服饰系列产品
图:2010-2014年美盛文化营业收入与净利润
表:2009-2013年美盛文化营业收入(分产品)构成
图:2009-2013年美盛文化营业收入(分区域)构成
表:2009-2013年美盛文化毛利率
表:2014-2016年美盛文化营业收入与净利润预测
表:动漫产品传播渠道对比分析
图:2005-2013年中国城镇居民人均可支配收入
图:2005-2013年中国城镇居民人均消费支出与人均教育文化娱乐服务支出
图:2002-2013年中国人口出生率
图:2002-2013年中国0-14岁人口占总人口比例
图:2014-2016年中国动漫行业产值预测
Industrial Chain of Animation Industry
Business Model of Animation Industry
Characteristics of "Industrial Culturalization" and " Cultural Industrialization"
Themes included in Classic Cartoon Images in America and Japan
Broadcast of Classic Cartoon Images
Correlation Effects of Animation Industry
Support Policy and Influence of Animation Industry in Developed Nations
Support Measures of Overseas Animation Industry
Three Tiers of Global Animation Industry
Major Countries’ Animation Development
Development History of American Animation Industry
Development History of Japanese Animation Industry
Japanese Animation Industry Chain
TOP Five Comics in Japan, 2013
Output Value and YoY Change of China Animation Industry, 2009-2013
Major Participants in Animation Industry
Representative Companies in China Animation Industrial Chain
Major Animation Images and Producers in China, 2007-2013
Six Animation Satellite TV Channels in China
Major Listed Companies in Animation Derivative Industry
Revenue and Net Income of Major Listed Companies in China Animation Derivative Industry, 2013-2014
YoY Change in Revenue and Net Income of Major Listed Companies in China Animation Derivative Industry, 2013-2014
Foreign Animation Enterprises’ Layout in China
Consumption Structure in Chinese Animation Content Market, 2012
IP Brands of Hasbro
IP Brands of Guangdong Alpha Animation And Culture
Number of IP of Companies in China Animation Industry Chain
Number of Chinese Animation, 2007-2013
Length of Chinese Animation, 2007-2013
Production of Chinese Animation (by Provinces), 2013
Number of Chinese Animated Film, 2009-2013
Box Office Revenue of Animated Films in Chinese Market, 2008-2013
Proportion of Chinese Animated Film’s Box Office Revenue to Total Animated Film Revenue in China, 2009-2013
Market Scale of Network Game in China, 2011-2017E
Market Scale Structure of Network Game in China, 2011-2017
Mobile Animation Industry Development in China and Japan, 2013 (as of April 2014)
Animation Business of Top Three Telecom Operators in China
TOP10 Animation Images in Chinese New Media Market, 2013
Animation Production in National Animation Bases in China, 2012
Types of Animation Industry Bases in China
Operation Mode of China Animation Industry Base
Market Structure of Animation Derivative in China, 2013
Market Scale of Animation Toy in China, 2007-2013
Global Toy Market Scale and Expense Per Capita, 2012
Market Scale of Animation Apparel in China, 2007-2013
Domestic Animation Apparel Enterprises in China
Global Disneyland Distribution
Shenzhen Huaqiang’s Theme Parks
Profile of Disney
Development History of Disney
Revenue and Net Income of Disney, FY2010-FY2014
Revenue and Operating Income of Disney (by Business Segments), FY2011-FY2013
Revenue and Operating Income of Disney (by Business Segments), FY2013-FY2014
Value Chain of Disneyland Brand
Industry Structure of Disneyland Brand
Business Model of Disneyland
Development History of Bandai Namco Group
Milestone of Bandai Namco Group
Financials of BANDAI NAMCO Holdings Inc., FY2011-FY2014
Net Sales and Operating Income of BANDAI NAMCO Holdings Inc. (by Segments), FY2013-FY2014
Net Sales and Operating Income of BANDAI NAMCO Holdings Inc. (by Regions), FY2013-FY2014
Financials of Bandai Namco Holdings Inc., 2015E
Net Sales and Operating Income of BANDAI NAMCO Holdings Inc. (by Segments), FY2015
Net Sales and Operating Income of BANDAI NAMCO Holdings Inc. (by Regions), FY2015
Investment Plan of Bandai Namco Holdings Inc.
Development Plan of Bandai Namco Holdings Inc. in Mid-long Term
Development History of Hasbro
Development Phases of Hasbro Brands
Brands of Hasbro
Revenue of Hasbro, 2003-2013
Revenue of Hasbro, Q1 2013 and Q1 2014
Gross Margin of Hasbro, 2003-2013
Revenue Structure of Hasbro (by Region), 2010-2013
Revenue Structure of Hasbro (by Region), Q1 2013 and Q1 2014
Revenue Structure of Hasbro (by Products), 2010-2013
Revenue Structure of Hasbro (by Products), Q1 2013 and Q1 2014
Branding Plan of Hasbro
Key Promotion Brands of Hasbro, 2014
Box Office of Animated Films of DreamWorks, 1998-2014
Development History of Pixar Animation Studios
Box Office of Animated Films of Pixar Animation
Basic Information of Toei Animation
Development History of Toei Animation
Production Process of Cartoon Images of Toei Animation
Business of Toei Animation
Global Distribution of Toei Animation
Financials of Toei Animation, FY2010-FY2014
Development History of Sotsu
Revenue and Net Income of Sotsu, FY2010-FY2014
Box Office of Animated Films of Studio Ghibli
Development History of Alpha Animation, 2011-2014
Revenue and Net Income of Alpha Animation, 2009-2014
Revenue Structure of Alpha Animation (by Segments), 2010-2013
Revenue Structure of Alpha Animation (by Regions), 2006-2013
Gross Margin of Alpha Animation (by Segments), 2010-2013
R & D Expense and % of Total Revenue of Alpha Animation, 2011-2013
Industry Chain of Alpha Animation
Development Direction of Mobile Terminal Business of Alpha Animation
Business Distribution of "Jia Jia Cartoon
Distribution Channels of Alpha Animation
Cooperation between Alpha Animation and Disney
Revenue and Net Income of Alpha Animation, 2014E-2016E
Group Structure of GDC
Development History of GDC
Financials of GDC, 2009-2013
Financials of GDC, 2013-2014
Revenue Structure of GDC (by Business Segments), 2013
Revenue Structure of GDC (by Regions), 2013
Industry Base of Fantawild
Theme Park Distribution of Fantawild in China
Culture Content Products and Service of Fantawild
Development Plan of Fantawild
Development History of Taomee
Financials of Taomee, 2012-2014
Major Partners of Taomee
Business Structure of Toonmax Media
Operating Business of Toonmax Media
Partners of Toonmax Media
Overview of Creative Power Entertaining
Introduction of Sparkly Key Animation Studio
Main Products of Vasoon Animation
Operating Indicators of KAKU Media Inc.
Business of KAKU Media Inc.
Business of Suzhou KAKU Film Animation Technology Co., Ltd
Major Partners of KAKU Media Inc.
Development Overview of Sunchime Cartoon Group
Development Overview of CCTV Animation Co., Ltd
Animated Works of CCTV Animation
Major Products of Huawei Technology
Revenue and Net Income of Huawei Technology, 2009-2014
Revenue Structure of Huawei Technology (by Products), 2009-2013
Revenue Structure of Huawei Technology (by Regions), 2010-2013
Gross Margin of Huawei Technology (by Products), 2009-2013
Revenue from Top Five Clients and % of Total Revenue of Huawei Technology, 2013
Procurement from Top Five Suppliers and % of Total Procurement of Huawei Technology, 2013
R & D Expense and % of Total Revenue of Huawei Technology, 2009-2013
Diyibo’s Game Products Adapted by Core IP
Revenue and Net Income of Huawei Technology, 2014E-2016E
Development Course of Meisheng Cultural & Creative
Meisheng Cultural & Creative’s Apparel Products
Revenue and Net Income of Meisheng Cultural & Creative, 2010-2014
Revenue Structure of Meisheng Cultural & Creative (by Products), 2009-2013
Revenue Structure of Meisheng Cultural & Creative (by Regions), 2009-2013
Gross Margin of Meisheng Cultural & Creative, 2009-2013
Revenue and Net Income of Meisheng Cultural & Creative, 2014E-2016E
Distribution Channels Contrast of Animation Products
Urban Per Capita Disposable Income of Urban Resident in China, 2005-2013
Urban Residents' Per Capita Consumption Expenditure and Per Capita Expense on Education and Cultural Entertainment Services in China, 2005-2013
Birth Rate in China, 2002-2013
% of Population Aged 0-14 to Total Population in China, 2013
Output Value of China Animation Industry, 2014E-2016E
如果这份报告不能满足您的要求,我们还可以为您定制报告,请 留言说明您的详细需求。
|