|
|
|
报告导航:研究报告—
生命科学—制药医疗
|
|
2014-2017年中国骨科器械行业研究报告 |
 |
字数:2.7万 |
页数:103 |
图表数:125 |
|
中文电子版:8000元 |
中文纸版:4000元 |
中文(电子+纸)版:8500元 |
|
英文电子版:2300美元 |
英文纸版:2450美元 |
英文(电子+纸)版:2600美元 |
|
编号:ZLC-007
|
发布日期:2014-08 |
附件:下载 |
 |
|
|
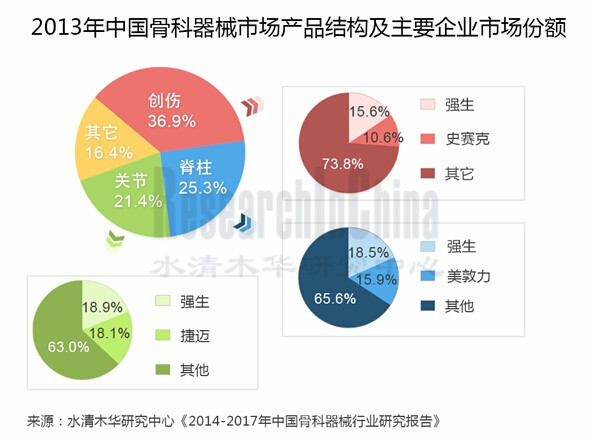
受益于人口老龄化的加快、医疗报销比例的上升等,中国骨科器械市场需求得到有效释放,2009-2013其市场规模年均复合增长率达19.2%。创伤产品、脊柱产品和关节产品是中国骨科器械三大细分产品。其中,创伤类产品市场规模相对最高,2013年其在中国骨科器械市场所占份额达到36.9%。
基于对中国骨科器械行业发展前景的看好,部分国内外企业正通过兼/并购方式加紧布局骨科市场。2012年,美敦力以8.16亿美元并购了中国最具竞争力的骨科生产商——康辉医疗。2013年1月,史赛克以59亿元港币收购了中国最大的创伤产品生产商——创生控股。2011年9月,微创医疗通过收购苏州贝斯特(交易额1.1亿元人民币)进入骨科器械市场;并于2014年1月,以2.9亿美元收购了美国Wright公司的关节重建业务。
目前中国骨科器械市场主要被强生、Zimmer、美敦力、史赛克等外资企业所占据,合占中国骨科器械市场40%-50%的份额。不过,中国本土骨科企业如威高股份、凯利泰、联合骨科等,近年来在研发和生产工艺方面均取得了一定进步,并依靠成本和渠道方面的优势,抢占了部分市场份额。
威高股份已成为中国本土规模最大的骨科企业,2013年其市场占有率为4.3%;凯利泰是中国椎体成形微创介入手术系统方面的领头羊,占中国PKP市场约50%的市场份额;联合骨科是中国人工膝、髋关节方面的龙头企业,在中国人工膝和髋关节市场的占有率约为4%-6%。
《2014-2017年中国骨科器械行业研究报告》主要包括以下内容:
 中国骨科器械市场发展概况,包括市场规模、市场结构、进出口、竞争格局、市场进入壁垒、销售模式等; 中国骨科器械市场发展概况,包括市场规模、市场结构、进出口、竞争格局、市场进入壁垒、销售模式等;
中国骨科器械市场发展环境,包括全球市场环境、政策环境、宏观环境、上下游行业以及发展前景等;
4家国外企业、14家中国本土骨科企业的经营情况以及骨科器械业务等。
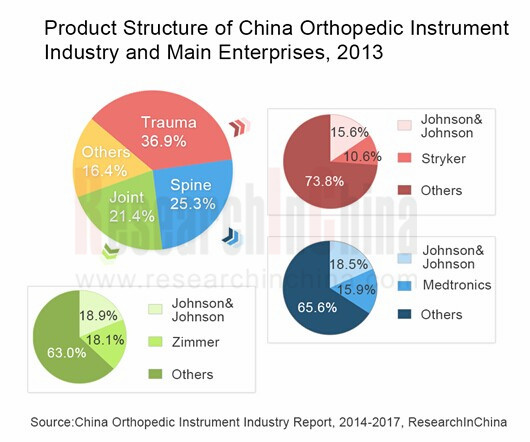
Benefiting from accelerated aging population and rising proportion of reimbursement for medical expenses, the Chinese orthopedic instrument market demand has been effectively released, with its scale presenting a CAGR of 19.2% during 2009-2013. Trauma products, spine products and joint products are three product segments of orthopedic instruments in China, of which trauma products holding the bulk with 36.9% market share in 2013.
Being optimistic about bright future of China orthopedic instrument industry, some foreign and domestic companies are speeding up their layout in orthopedic instrument market though mergers and acquisitions. In 2012, Medtronic, Inc. acquired the most competitive orthopedic device maker in China-- China Kanghui Holdings for USD 816 million; In Jan. 2013, Stryker Corporation bought China’s largest trauma product makers-- Trauson Holdings Company Limited for HKD5.9 billion; In Sep. 2011, MicroPort Scientific Corporation entered orthopedic instrument market by purchasing Suzhou Best at transaction value of RMB 110 million, and acquired Wright's OrthoRecon business at USD 290 million in Jan. 2014.
The Chinese orthopedic instrument market now is dominated by Johnson & Johnson, Zimmer, Medtronic, Stryker and other foreign companies, together holding 40%-50% market share. However, local Chinese companies like Shandong Weigao Group Medical Polymer Co. Limited, Shanghai Kinetic Medical Co., Ltd. and United Orthopedic Corporation have made some progress in R&D and production technology in recent years, and grabbed some marker share by virtue of advantages in cost and channel.
Shandong Weigao Group Medical Polymer has become the largest local orthopedics company in China with a market share of 4.3%; Shanghai Kinetic Medical is a leader in vertebroplasty interventional operation system, occupying about 50% of the Chinese percutaneous kyphoplasty (PKP) market; United Orthopedic Corporation is a champion in artificial knee/hip joint with 4%-6% market share in China.
China Orthopedic Instrument Industry Report, 2014-2017 focuses on the following:
Development of the Chinese orthopedic instrument market, including market size, market structure, import & export, competitive landscape, barriers to entry and sales model;
 Development environment of the Chinese orthopedic instrument market, covering global market environment, policy environment, macro environment, upstream and downstream sectors and development prospects; Development environment of the Chinese orthopedic instrument market, covering global market environment, policy environment, macro environment, upstream and downstream sectors and development prospects;
Operation and orthopedic instrument business of 4 foreign and 14 local Chinese orthopedics companies.
第一章 骨科器械行业概述
1.1 定义
1.2 分类
1.3 产业链
第二章 全球骨科器械行业发展现状
2.1 发展概况
2.2 发展预测
第三章 中国骨科器械行业发展现状
3.1 发展概况
3.2 市场结构
3.3 进出口
3.3.1 进口
3.3.2 出口
3.4 竞争格局
3.5 进入壁垒
3.5.1 技术工艺壁垒
3.5.2 市场准入壁垒
3.5.3 销售渠道壁垒
3.5.4 人才壁垒
3.6 销售模式
第四章 中国骨科器械行业发展环境
4.1 政策环境
4.1.1 监管政策
4.1.2 行业政策
4.2 宏观环境
4.3 上下游行业
4.3.1 上游行业
4.3.2 下游行业
4.4 发展前景
第五章 在华国外企业
5.1 Johnson & Johnson
5.1.1 公司简介
5.1.2 经营情况
5.1.3 营收构成
5.1.4 毛利率
5.1.5 骨科器械业务
5.1.6 在华发展
5.2 Medtronic
5.2.1 公司简介
5.2.2 经营情况
5.2.3 营收构成
5.2.4 毛利率
5.2.5 骨科器械业务
5.2.6 在华发展
5.3 Stryker
5.3.1 公司简介
5.3.2 经营情况
5.3.3 营收构成
5.3.4 毛利率
5.3.5 在华发展
5.4 Zimmer
5.4.1 公司简介
5.4.2 经营情况
5.4.3 营收构成
5.4.4 毛利率
5.4.5 骨科器械业务
5.4.6 在华发展
第六章 中国主要企业
6.1 威高股份
6.1.1 公司简介
6.1.2 经营情况
6.1.3 营收构成
6.1.4 毛利率
6.1.5 骨科器械业务
6.1.6 研发与投资
6.1.7 客户
6.1.8 预测与展望
6.2 凯利泰
6.2.1 公司简介
6.2.2 经营情况
6.2.3 营收构成
6.2.4 毛利率
6.2.5 研发与投资
6.2.6 预测与展望
6.3 联合骨科
6.3.1 公司简介
6.3.2 经营情况
6.3.3 营收构成
6.3.4 毛利率
6.3.5 研发与投资
6.3.6 预测与展望
6.4 爱康宜诚
6.4.1 公司简介
6.4.2 经营情况
6.4.3 营收构成
6.4.4 毛利率
6.4.5 研发与投资
6.4.6 产能、产量及销量
6.4.7 客户及供应商
6.5 欣荣博尔特
6.5.1 公司简介
6.5.2 经营情况
6.5.3 骨科器械业务
6.6 天津威曼
6.6.1 公司简介
6.6.2 经营情况
6.6.3 骨科器械业务
6.7 力达康
6.7.1 公司简介
6.7.2 经营情况
6.7.3 骨科器械业务
6.8 人立骨科
6.8.1 公司简介
6.8.2 经营情况
6.9 广慈医械
6.9.1 公司简介
6.9.2 骨科器械业务
6.10 爱得科技
6.10.1 公司简介
6.10.2 骨科器械业务
6.11 春立正达
6.11.1 公司简介
6.11.2 骨科器械业务
6.12 百慕航材
6.12.1 公司简介
6.12.2 骨科器械业务
6.13 康力骨科
6.13.1 公司简介
6.13.2 骨科器械业务
6.14 华森医疗
6.14.1 公司简介
6.14.2 骨科器械业务
第七章 预测与展望
7.1 市场规模预测
7.2 主要企业经营对比
7.2.1 营业收入
7.2.2 净利润
7.2.3 毛利率
7.2.4 骨科器械业务
1. Overview of Orthopedic Instrument Industry
1.1 Definition
1.2 Classification
1.3 Industry Chain
2. Development of Global Orthopedic Instrument Industry
2.1 Overview
2.2 Forecast
3. Development of China Orthopedic Instrument Industry
3.1 Overview
3.2 Market Structure
3.3 Import and Export
3.3.1 Import
3.3.2 Export
3.4 Competitive Landscape
3.5 Barriers to Entry
3.5.1 Technology Barrier
3.5.2 Market Access Barrier
3.5.3 Sales Channel Barrier
3.5.4 Talent Barrier
3.6 Sales Model
4. Development Environment of China Orthopedic Instrument Industry
4.1 Policy Environment
4.1.1 Regulatory Policy
4.1.2 Industrial Policy
4.2 Macro Environment
4.3 Upstream and Downstream Industries
4.3.1 Upstream Industry
4.3.2 Downstream Industry
4.4 Prospects
5. Foreign Companies in China
5.1 Johnson & Johnson
5.1.1 Profile
5.1.2 Operation
5.1.3 Revenue Structure
5.1.4 Gross Margin
5.1.5 Orthopedic Instrument Business
5.1.6 Development in China
5.2 Medtronic
5.2.1 Profile
5.2.2 Operation
5.2.3 Revenue Structure
5.2.4 Gross Margin
5.2.5 Orthopedic Instrument Business
5.2.6 Development in China
5.3 Stryker
5.3.1 Profile
5.3.2 Operation
5.3.3 Revenue Structure
5.3.4 Gross Margin
5.3.5 Development in China
5.4 Zimmer
5.4.1 Profile
5.4.2 Operation
5.4.3 Revenue Structure
5.4.4 Gross Margin
5.4.5 Orthopedic Instrument Business
5.4.6 Development in China
6. Major Chinese Companies
6.1 Shandong Weigao Group Medical Polymer
6.1.1 Profile
6.1.2 Operation
6.1.3 Revenue Structure
6.1.4 Gross Margin
6.1.5 Orthopedic Instrument Business
6.1.6 R&D and Investment
6.1.7 Customers
6.1.8 Forecast and Outlook
6.2 Shanghai Kinetic Medical
6.2.1 Profile
6.2.2 Operation
6.2.3 Revenue Structure
6.2.4 Gross Margin
6.2.5 R&D and Investment
6.2.6 Forecast and Outlook
6.3 United Orthopedic Corporation
6.3.1 Profile
6.3.2 Operation
6.3.3 Revenue Structure
6.3.4 Gross Margin
6.3.5 R&D and Investment
6.3.6 Forecast and Outlook
6.4 Beijing AKEC Medical
6.4.1 Profile
6.4.2 Operation
6.4.3 Revenue Structure
6.4.4 Gross Margin
6.4.5 R&D and Investment
6.4.6 Capacity, Output and Sales Volume
6.4.7 Customers and Suppliers
6.5 Suzou Xinrong Best Medical Instrument
6.5.1 Profile
6.5.2 Operation
6.5.3 Orthopedic Instrument Business
6.6 Tianjin Walkman Biomaterial
6.6.1 Profile
6.6.2 Operation
6.6.3 Orthopedic Instrument Business
6.7 Beijing Lidakang Science and Technology
6.7.1 Profile
6.7.2 Operation
6.7.3 Orthopedic Instrument Business
6.8 Tianjin Renli Orthopedic Instrument
6.8.1 Profile
6.8.2 Operation
6.9 Zhejiang Guangci Medical Device
6.9.1 Profile
6.9.2 Orthopedic Instrument Business
6.10 Suzhou AND Science & Technology Development
6.10.1 Profile
6.10.2 Orthopedic Instrument Business
6.11 Beijing Chunlizhengda Technology & Development
6.11.1 Profile
6.11.2 Orthopedic Instrument Business
6.12 Baimtec Material
6.12.1 Profile
6.12.2 Orthopedic Instrument Business
6.13 Suzhou Kangli Orthopedics Instrument
6.13.1 Profile
6.13.2 Orthopedic Instrument Business
6.14 Waston Medical Appliance
6.14.1 Profile
6.14.2 Orthopedic Instrument Business
7. Forecast and Outlook
7.1 Market Size Forecast
7.2 Operation Comparison of Major Companies
7.2.1 Revenue
7.2.2 Net Income
7.2.3 Gross Margin
7.2.4 Orthopedic Instrument Business
表:骨科器械行业类别
图:骨科器械行业产业链
图:2009-2013年全球骨科器械市场规模及增速
图:2013年全球骨科器械市场份额(分产品)
图:2012-2017E全球骨科器械市场规模预测
图:2009-2013年中国规模以上医疗器械行业市场规模及增速
图:2009-2013中国骨科器械行业市场规模及增速
图:2009-2013年中国骨科器械市场规模(分产品)
图:2009-2013年中国骨科器械市场份额(分产品)
图:2009-2014年中国矫形或骨折用器具进口量及金额
图:2014上半年中国矫形或骨折用器具进口量前十的国家和地区
图:2009-2014年中国人造关节进口量及金额
表:2014上半年中国人造关节进口量前十的国家和地区
图:2009-2014年中国矫形或骨折用器具出口量及金额
表:2014上半年中国矫形或骨折用器具出口量前十的国家和地区
图:2009-2014年中国人工关节出口量及金额
图:2014上半年中国人工关节出口量前十的国家和地区
表:2013年中国骨科器械行业竞争格局
图:2013年中国骨科器械市场份额
图:2013年中国骨科器械行业创伤类市场份额
图:2013年中国骨科器械行业脊柱类市场份额
图:2013年中国骨科器械行业关节类市场份额
图:骨科器械产品批文申请流程
图:中国骨科器械销售流程
表:2007-2014年中国骨科器械行业政策及主要内容
图:1980-2013年中国卫生费用及所占DGP比重
图:2006-2012年中国人均卫生费用及同比增长率
图:2004-2013年中国65岁及以上老年人数量及所占总人口比例
表:2012-2013年中国医疗机构个数
表:2012-2013年中国卫生机构医疗服务量
图:2009-2014年强生公司总收入及净利润
图:2009-2014年强生公司总收入(分产品)
图:2009-2014年强生公司总收入构成(分产品)
图:2009-2014年强生公司毛利率
图:2010-2013年强生公司骨科业务收入及占总收入比例
表:强生公司在华企业及主要产品
图:FY2010-2014年美敦力营业收入及净利润
图:FY2010-2014年美敦力营业收入(分产品)
图:FY2010-2014年美敦力营业收入构成(分产品)
图:FY2010-2014年美敦力毛利率
图:FY2012-2014年美敦力脊柱业务收入及占营业收入比例
图:2009-2014年史赛克营业收入及净利润
图:2009-2014年史赛克营业收入(分产品)
图:2009-2014年史赛克营业收入构成(分产品)
表:2011-2013年史赛克修复产品营业收入及构成(按用途)
表:2011-2013年史赛克医疗系统营业收入及构成(按用途)
表:2011-2013年史赛克神经技术和脊椎营业收入及构成(按用途)
图:2009-2014年史赛克毛利率
图:2009-2012年创生控股营业收入及净利润
图:2009-2012年创生控股营业收入(分产品)
图:2009-2012年创生控股毛利率
表:2008-2011年创生控股主要产品产量
表:2008-2011年创生控股主要产品产能利用率
图:2009-2014年Zimmer营业收入及净利润
图:2009-2014年Zimmer营业收入(分地区)
图:2009-2014年Zimmer营业收入构成(分地区)
图:2009-2014年Zimmer营业收入(分产品)
图:2009-2014年Zimmer营业收入构成(分产品)
图:2009-2014年Zimmer毛利率
图:2009-2014年Zimmer的Reconstructive产品营业收入
表:威高股份产品种类及主要产品
图:2009-2014年威高股份营业收入及净利润
图:2009-2013年威高股份营业收入(分产品)
图:2009-2013年威高股份营业收入构成(分产品)
表:2012-2013年威高股份一次性医疗耗材营业收入(分产品)
图:2009-2013年威高股份毛利率
图:2009-2013年威高股份骨科产品营业收入及同比增长
图:2009-2013年威高股份研发投入及占营业收入比例
表:2007-2013年威高的专利和注册证书数量
图:2008-2013年威高股份客户数量(分性质)
图:2012-2017E威高股份营业收入及净利润预测
图:2009-2013年凯利泰营业收入及净利润
图:2009-2013年凯利泰营业收入(分产品)
图:2009-2013年凯利泰营业收入构成(分地区)
图:2009-2013年凯利泰毛利率
图:2009-2013年凯利泰毛利率(分地区)
表:2013年凯利泰研发项目完成情况
图:2011-2013年凯利泰研发投入及占营业收入比例
图:2013年凯利泰经营范围
图:2012-2017E凯利泰营业收入及净利润预测
图:联合骨科销售区域分布
图:2009-2014年联合骨科营业收入及毛利
图:2010-2013年联合骨科营业收入(分地区)
图:2010-2013年联合骨科营业收入构成(分产品)
图:2009-2013年联合骨科毛利率
图:2009-2014年联合骨科研发投入及占营业收入比
图:2012-2017E联合骨科营业收入及毛利预测
图:2009-2011年爱康宜诚营业收入及净利润
图:2009-2011年爱康宜诚营业收入构成(按产品)
图:2009-2011年爱康宜诚营业收入构成(按地区)
表:2009-2011年爱康宜诚毛利率(按产品)
表:2009-2011年爱康宜诚主要产品毛利率
图:2009-2011年爱康宜诚研发投入及占营业收入比
表:2012年爱康宜诚幕投项目
表:2009-2011年爱康宜诚产能、产量及产能利用率
表:2009-2011年爱康宜诚产量、销量及产销率
表:2009-2011年爱康宜诚前五名客户及销售额
表:2009-2011年爱康宜诚前五名供应商及采购金额
图:2007-2009年欣荣博尔特营业收入及利润总额
图:2007-2009年欣荣博尔特毛利率
图:2007-2009年欣荣博尔特资产总额及负债总额
表:欣荣博尔特骨科产品分类
图:2007-2009年威曼营业收入及利润总额
图:2007-2009年威曼毛利率
图:2007-2009年威曼资产总额及负债总额
表:天津威曼骨科器械分类产品
图:2007-2009年力达康营业收入及利润总额
图:2007-2009年力达康毛利率
图:2007-2009年力达康资产总额及负债总额
表:力达康骨科器械产品分类
图:2007-2009年人立骨科营业收入及利润总额
图:2007-2009年人立骨科毛利率
图:2007-2009年人立骨科资产总额及负债总额
表:广慈医械主要骨科器械产品
表:爱得科技骨科器械产品分类
表:春立正达骨科器械产品分类
表:华森医疗骨科器械产品分类
图:2012-2017E中国骨科器械市场规模预测
图:2012-2017E中国骨科器械市场规模预测(分产品)
图:2012-2017E中国骨科器械市场份额(分产品)
图:2009-2014年中国骨科器械行业主要企业营业收入对比
图:2009-2014年中国骨科器械行业主要企业净利润对比
图:2009-2014年中国骨科器械行业主要企业净利润率对比
图:2009-2013年中国骨科器械行业主要企业毛利率对比
图:2009-2013年中国骨科器械主要企业骨科器械业务收入对比
Category of Orthopedic Instrument Industry
Orthopedic Instrument Industry Chain
Global Orthopedic Instrument Market Size and Growth Rate, 2009-2013
Global Market Share of Orthopedic Instruments by Product, 2013
Global Orthopedic Instrument Market Size, 2012-2017E
Market Size and Growth Rate of Orthopedic Instrument Industry above Designated Scale in China, 2009-2013
Market Size and Growth Rate of China Orthopedic Instrument Industry, 2009-2013
Market Size of Orthopedic Instruments in China by Product, 2009-2013
Market Share of Orthopedic Instruments in China by Product, 2009-2013
Import Volume and Value of Orthopedic or Fracture Appliances in China, 2009-2014
Top10 Sources of Imported Orthopedic or Fracture Appliances by Import Volume in China, H1 2014
Import Volume and Value of Artificial Joint in China, 2009-2014
Top10 Sources of Imported Artificial Joint in China by Import Volume, H1 2014
Export Volume and Value of Orthopedic or Fracture Appliances from China, 2009-2014
Top10 Destinations of Exported Orthopedic or Fracture Appliances from China by Export Volume, H1 2014
Export Volume and Value of Artificial Joint in China, 2009-2014
Top10 Destinations of Exported Artificial Joint from China by Export Volume, H1 2014
Competitive Landscape of China Orthopedic Instrument Industry, 2013
Chinese Orthopedic Instrument Market Structure by Company, 2013
Market Share of Trauma Instruments in China Orthopedic Instrument Industry, 2013
Market Share of Spine Instruments in China Orthopedic Instrument Industry, 2013
Market Share of Joints in China Orthopedic Instrument Industry, 2013
Application Process for Orthopedic Instrument Products Permit
Sales Process of Orthopedic Instruments in China
Policies and Main Contents Concerning Orthopedic Instrument Industry in China, 2007-2014
Health Costs and % of GDP in China, 1980-2013
Per Capita Health Costs and YoY Growth Rate in China, 2006-2012
Number of People 65 and over and % of Total Population, 2004-2013
Number of Medical Institutions in China, 2012-2013
Medical Service Quantity of Health Care Facilities in China, 2012-2013
Total Revenue and Net Income of Johnson & Johnson, 2009-2014
Total Revenue Breakdown of Johnson & Johnson (by Product), 2009-2014
Total Revenue Structure of Johnson & Johnson (by Product), 2009-2014
Gross Margin of Johnson & Johnson, 2009-2014
Orthopedics Business Revenue and % of Total Revenue of Johnson & Johnson, 2010-2013
Johnson & Johnson’s Companies in China and Main Products
Revenue and Net Income of Medtronic, FY2010- FY2014
Revenue Breakdown of Medtronic (by Product), FY2010- FY2014
Revenue Structure of Medtronic (by Product), FY2010- FY2014
Gross Margin of Medtronic, FY2010- FY2014
Spine Business Revenue and % of Total Revenue of Medtronic, FY2012- FY2014
Revenue and Net Income of Stryker, 2009-2014
Revenue Breakdown of Stryker (by Product), 2009-2014
Revenue Structure of Stryker (by Product), 2009-2014
Reconstructive Business Revenue and Structure of Stryker by Purpose, 2011-2013
MedSurg Business Revenue and Structure of Stryker by Purpose, 2011-2013
Neurotechnology & Spine Business Revenue and Structure of Stryker by Purpose, 2011-2013
Gross Margin of Stryker, 2009-2014
Revenue and Net Income of Trauson Holdings, 2009-2012
Revenue Breakdown of Trauson Holdings (by Product), 2009-2012
Gross Margin of Trauson Holdings, 2009-2012
Output of Main Products of Trauson Holdings, 2008-2011
Capacity Utilization of Main Products of Trauson Holdings, 2008-2011
Revenue and Net Income of Zimmer, 2009-2014
Revenue Breakdown of Zimmer (by Region), 2009-2014
Revenue Structure of Zimmer (by Region), 2009-2014
Revenue Breakdown of Zimmer (by Product), 2009-2014
Revenue Structure of Zimmer (by Product), 2009-2014
Gross Margin of Zimmer, 2009-2014
Zimmer’s Revenue from Reconstructive Products, 2009-2014
Product Varieties and Main Products of Shandong Weigao Group Medical Polymer
Revenue and Net Income of Shandong Weigao Group Medical Polymer, 2009-2014
Revenue Breakdown of Shandong Weigao Group Medical Polymer (by Product), 2009-2013
Revenue Structure of Shandong Weigao Group Medical Polymer (by Product), 2009-2013
Shandong Weigao Group Medical Polymer’s Revenue Breakdown from Single-use Medical Consumables (by Product), 2012-2013
Gross Margin of Shandong Weigao Group Medical Polymer, 2009-2013
Shandong Weigao Group Medical Polymer’s Revenue from Orthopedic Products and YoY Growth, 2009-2013
R&D Costs and % of Total Revenue of Shandong Weigao Group Medical Polymer, 2009-2013
Number of Patents and Registered Certificates of Shandong Weigao Group Medical Polymer, 2007-2013
Number of Customers of Shandong Weigao Group Medical Polymer (by Nature), 2008-2013
Revenue and Net Income of Shandong Weigao Group Medical Polymer, 2012-2017E
Revenue and Net Income of Shanghai Kinetic Medical, 2009-2013
Revenue Breakdown of Shanghai Kinetic Medical (by Region), 2009-2013
Revenue Structure of Shanghai Kinetic Medical (by Region), 2009-2013
Gross Margin of Shanghai Kinetic Medical, 2009-2013
Gross Margin of Shanghai Kinetic Medical (by Region), 2009-2013
Completion Status of R&D Projects of Shanghai Kinetic Medical, 2013
R&D Costs and % of Total Revenue of Shanghai Kinetic Medical, 2011-2013
Business Scope of Shanghai Kinetic Medical, 2013
Revenue and Net Income of Shanghai Kinetic Medical, 2012-2017E
Sales Regions of United Orthopedic
Revenue and Gross Profit of United Orthopedic, 2009-2014
Revenue Breakdown of United Orthopedic (by Region), 2010-2013
Revenue Structure of United Orthopedic (by Product), 2010-2013
Gross Margin of United Orthopedic, 2009-2013
R&D Costs and % of Total Revenue of United Orthopedic, 2009-2014
Revenue and Gross Profit of United Orthopedic, 2012-2017E
Revenue and Net Income of Beijing AKEC Medical, 2009-2011
Revenue Structure of Beijing AKEC Medical (by Product), 2009-2011
Revenue Structure of Beijing AKEC Medical (by Region), 2009-2011
Gross Margin of Beijing AKEC Medical (by Product), 2009-2011
Gross Margin of Main Products of Beijing AKEC Medical, 2009-2011
R&D Costs and % of Total Revenue of Beijing AKEC Medical, 2009-2011
Fundraising Projects of Beijing AKEC Medical, 2012
Capacity, Output and Capacity Utilization of Beijing AKEC Medical, 2009-2011
Output, Sales Volume and Sales/Output Ratio of Beijing AKEC Medical, 2009-2011
Name list and Sales Contribution of Beijing AKEC Medical’s Top 5 Customers, 2009-2011
Name list and Procurement of Beijing AKEC Medical’s Top 5 Suppliers, 2009-2011
Revenue and Total Profit of Suzou Xinrong Best Medical Instrument, 2007-2009
Gross Margin of Suzou Xinrong Best Medical Instrument, 2007-2009
Total Assets and Total Liabilities of Suzou Xinrong Best Medical Instrument, 2007-2009
Suzou Xinrong Best Medical Instrument’s Orthopedic Products by Category
Revenue and Total Profit of Tianjin Walkman Biomaterial, 2007-2009
Gross Margin of Tianjin Walkman Biomaterial, 2007-2009
Total Assets and Total Liabilities of Tianjin Walkman Biomaterial, 2007-2009
Tianjin Walkman Biomaterial’s Orthopedic Instruments by Category
Revenue and Total Profit of Beijing Lidakang Science and Technology, 2007-2009
Gross Margin of Beijing Lidakang Science and Technology, 2007-2009
Total Assets and Total Liabilities of Beijing Lidakang Science and Technology, 2007-2009
Beijing Lidakang Science and Technology’s Orthopedic Instruments by Category
Revenue and Total Profit of Tianjin Renli Orthopedic Instrument, 2007-2009
Gross Margin of Tianjin Renli Orthopedic Instrument, 2007-2009
Total Assets and Total Liabilities of Tianjin Renli Orthopedic Instrument, 2007-2009
Main Orthopedic Instruments of Zhejiang Guangci Medical Device
Suzhou AND Science & Technology Development’s Orthopedic Instruments by Category
Beijing Chunlizhengda Technology & Development’s Orthopedic Instruments by Category
Waston Medical Appliance’s Orthopedic Instruments by Category
China Orthopedic Instrument Market Size, 2012-2017E
China Orthopedic Instrument Market Size (by Product), 2012-2017E
Market Share of Orthopedic Instruments in China (by Product), 2012-2017E
Revenue Comparison of Major Companies in China Orthopedic Instrument Industry, 2009-2014
Net Income Comparison of Major Companies in China Orthopedic Instrument Industry, 2009-2014
Net Profit Margin Comparison of Major Companies in China Orthopedic Instrument Industry, 2009-2014
Gross Margin Comparison of Major Companies in China Orthopedic Instrument Industry, 2009-2013
Orthopedic Instrument Business Revenue of Major Companies in China Orthopedic Instrument Industry, 2009-2013
如果这份报告不能满足您的要求,我们还可以为您定制报告,请 留言说明您的详细需求。
|