|
|
|
报告导航:研究报告—
制造业—化工
|
|
2014-2017年中国印染助剂行业研究报告 |
 |
字数:3.6万 |
页数:98 |
图表数:123 |
|
中文电子版:7500元 |
中文纸版:3750元 |
中文(电子+纸)版:8000元 |
|
英文电子版:2150美元 |
英文纸版:2300美元 |
英文(电子+纸)版:2450美元 |
|
编号:QJC013
|
发布日期:2014-09 |
附件:下载 |
 |
|
|
印染助剂对纺织工业产品的升级换代及提高附加值至关重要。2006-2012年,中国印染助剂产量总体呈上升趋势,年均复合增长率达8.8%。2013年,中国印染助剂产量达136.6万吨,较2012年略有增长。
中国印染助剂行业的对外依存度不高,但专用和高档印染助剂仍需要依赖进口。2008-2013年,受益于中国印染工业技术进步等,中国纺织助剂进口量总体呈下降趋势。2014年1-7月,中国进口纺织助剂1.63万吨,同比下降6.6%。
2013年,中国印染助剂行业共拥有生产企业2000-3000家,主要分布在江苏、浙江、广东、山东、福建等沿海地区,2013年这五省的印染助剂产能占全国总产能的90%左右。
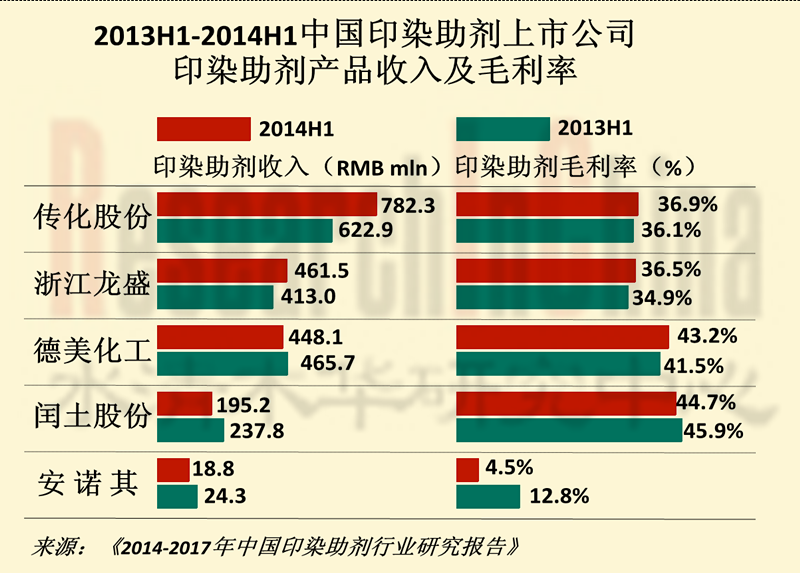
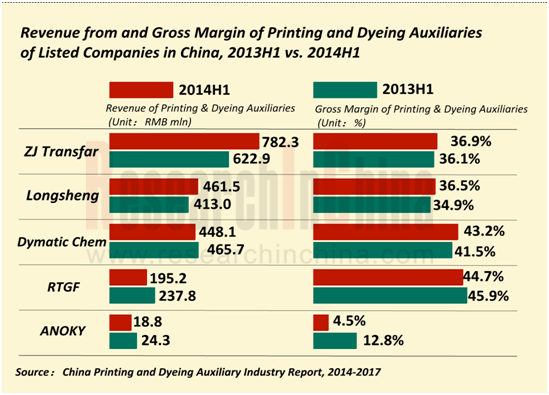
传化股份与德美化工是中国印染助剂龙头企业,市场占有率保持在10%左右。2009-2014年,两公司染料助剂毛利率均保持在30%以上,且总体呈增长趋势。其中,传化股份通过拓展顺丁胶业务,发掘新兴增长点;德美化工通过开发低温练漂、防沾色清洗等高端产品,继续强化其在纺织化学品领域的行业地位。
伴随环保政策日趋严厉,印染助剂产业落后产能将逐步被淘汰,行业集中度将不断提升。目前中国印染助剂占纺织纤维(纺织行业主要原材料)总量的3%,而国际发达国家该比例在7%左右,中国印染助剂未来发展空间较大。预计到2017年,中国印染助剂产量将增长至169.3万吨。
水清木华研究中心《2014-2017年中国印染助剂行业研究报告》主要包括以下几个内容:
 中国印染助剂行业政策、供需分析、竞争格局、进出口及发展预测等; 中国印染助剂行业政策、供需分析、竞争格局、进出口及发展预测等;
中国印染行业运营分析、供需分析、投资分析、进出口及发展预测等;
中国9家印染助剂生产企业的经营状况、印染助剂业务及发展预测等;
中国3家印染加工企业的经营状况、印染业务及发展预测等。
Printing and dyeing auxiliaries are crucial for the upgrading and generation replacement of textile products and the growth of added value. In 2006-2012, China’s printing and dyeing auxiliary output showed an uptrend with a CAGR of 8.8%. In 2013, the output reached 1.366 million tons, representing a slight increase over 2012.
China printing and dyeing auxiliary industry does not depend on import, but it has to introduce special and upscale auxiliaries from other countries frequently. Benefiting from technological progress, China’s import volume of textile auxiliaries embodied a downward trend in 2008-2013. From January to July of 2014, China imported 16,300 tons of textile auxiliaries, down 6.6% year on year.
In 2013, there were 2,000-3,000 production enterprises in China printing and dyeing auxiliary industry, mainly located in Jiangsu, Zhejiang, Guangdong, Shandong, Fujian and other coastal areas. In the same year, these five above provinces contributed 90% or so to the total capacity of printing and dyeing auxiliaries in China.
Zhejiang Transfar and Dymatic Chemicals are leading enterprises in China printing and dyeing auxiliary industry, with the market share of around 10%. In 2009-2014, both of them see their gross margin of dyeing auxiliaries at over 30% with an increasing trend. Zhejiang Transfar seeks for new growth engines by extending to butadiene rubber business; meanwhile, Dymatic Chemicals continues to consolidate its position in the industry through developing high-end products such as low-temperature bleaching and anti-staining cleaning products.
In the wake of increasingly stringent environmental policies, the backward capacity of the printing and dyeing auxiliary industry will be gradually eliminated and the concentration degree of the industry is to jump. At present, China’s printing and dyeing auxiliaries account for 3% of textile fibers, lower than 7% in developed countries, which marks China’s huge potentials. China’s output of printing and dyeing auxiliary is expected to hit 1.693 million tons in 2017.
The report includes the following:
 Policy, supply, demand, competition pattern, import & export, and development forecast of China printing and dyeing auxiliary industry; Policy, supply, demand, competition pattern, import & export, and development forecast of China printing and dyeing auxiliary industry;
Operation, supply, demand, investment, import & export and development prediction of China printing and dyeing industry;
Operation, printing and dyeing auxiliary business, and development forecast of nine printing and dyeing auxiliary producers in China;
Operation, printing and dyeing business, and development forecast of three printing and dyeing enterprises in China.
第一章 印染助剂行业概述
1.1 定义及作用
1.2 分类
1.3 产业链
1.4 行业概述
第二章 中国印染助剂行业分析
2.1 发展现状
2.2 政策环境
2.3 供需分析
2.4 竞争格局
2.5 进出口分析
第三章 中国印染行业经济运行情况
3.1 运营分析
3.2 供给分析
3.3 投资情况
3.4 出口分析
第四章 中国主要生产企业
4.1 传化股份
4.1.1 公司简介
4.1.2 经营状况
4.1.3 营收构成
4.1.4 毛利率
4.1.5 客户
4.1.6 印染助剂业务
4.1.7 预测与展望
4.2 德美化工
4.2.1 公司简介
4.2.2 经营情况
4.2.3 营收构成
4.2.4 毛利率
4.2.5 客户
4.2.6 印染助剂业务
4.2.7 预测与展望
4.3 浙江龙盛
4.3.1 公司简介
4.3.2 经营情况
4.3.3 营收构成
4.3.4 毛利率
4.3.5 客户
4.3.6 印染助剂业务
4.3.7 预测与展望
4.4 闰土股份
4.4.1 公司简介
4.4.2 经营情况
4.4.3 营收构成
4.4.4 毛利率
4.4.5 客户
4.4.6 印染助剂业务
4.4.7 预测与展望
4.5 安诺其
4.5.1 公司简介
4.5.2 经营情况
4.5.3 营收构成
4.5.4 毛利率
4.5.5 客户
4.5.6 印染助剂业务
4.5.7 预测与展望
4.6 恒星化工
4.6.1 公司简介
4.6.2 经营情况
4.6.3 印染助剂业务
4.7 美高化工
4.7.1 公司简介
4.7.2 经营情况
4.7.3 印染助剂业务
4.8 大祥化工
4.8.1 公司简介
4.8.2 经营情况
4.8.3 印染助剂业务
4.9 宏达化学
第五章 中国主要印染企业
5.1 航民股份
5.1.1 公司简介
5.1.2 经营情况
5.1.3 营收构成
5.1.4 毛利率
5.1.5 客户
5.1.6 印染业务
5.1.7 预测与展望
5.2 众和股份
5.2.1 公司简介
5.2.2 经营情况
5.2.3 营收构成
5.2.4 毛利率
5.2.5 客户
5.2.6 印染业务
5.2.7 预测与展望
5.3 三房巷
5.3.1 公司简介
5.3.2 经营情况
5.3.3 营收构成
5.3.4 毛利率
5.3.5 客户
5.3.6 印染业务
5.3.7 预测与展望
第六章 预测与展望
6.1 印染助剂行业
6.1.1 发展趋势
6.1.2 企业经营
6.1.3 供需预测
6.2 印染行业
6.2.1 发展趋势
6.2.2 企业经营
6.2.3 供给预测
1. Overview of Printing and Dyeing Auxiliary Industry
1.1 Definition and Application
1.2 Classification
1.3 Industry Chain
1.4 Industry Overview
2. China Printing and Dyeing Auxiliary Industry
2.1 Development Status
2.2 Policy Environment
2.3 Supply and Demand
2.4 Competition Pattern
2.5 Import and Export
3. Economic Operation of China Printing and Dyeing Industry
3.1 Operation
3.2 Supply
3.3 Investment
3.4 Export
4. Key Enterprises in China
4.1 Zhejiang Transfar Co., Ltd.
4.1.1 Profile
4.1.2 Operation
4.1.3 Revenue Structure
4.1.4 Gross Margin
4.1.5 Customers
4.1.6 Printing and Dyeing Auxiliary Business
4.1.7 Forecast and Prospect
4.2 Dymatic Chemicals Inc.
4.2.1 Profile
4.2.2 Operation
4.2.3 Revenue Structure
4.2.4 Gross Margin
4.2.5 Customers
4.2.6 Printing and Dyeing Auxiliary Business
4.2.7 Forecast and Prospect
4.3 Zhejiang Longsheng Group Co., Ltd.
4.3.1 Profile
4.3.2 Operation
4.3.3 Revenue Structure
4.3.4 Gross Margin
4.3.5 Customers
4.3.6 Printing and Dyeing Auxiliary Business
4.3.7 Forecast and Prospect
4.4 Zhejiang Runtu Co., Ltd.
4.4.1 Profile
4.4.2 Operation
4.4.3 Revenue Structure
4.4.4 Gross Margin
4.4.5 Customers
4.4.6 Printing and Dyeing Auxiliary Business
4.4.7 Forecast and Prospect
4.5 Shanghai Anoky Textile Chem Co., Ltd.
4.5.1 Profile
4.5.2 Operation
4.5.3 Revenue Structure
4.5.4 Gross Margin
4.5.5 Customers
4.5.6 Printing and Dyeing Auxiliary Business
4.5.7 Forecast and Prospect
4.6 Sunichem Group
4.6.1 Profile
4.6.2 Operation
4.6.3 Printing and Dyeing Auxiliary Business
4.7 Hangzhou Meigao Huayi Chemical Co., Ltd. (MG Chemical)
4.7.1 Profile
4.7.2 Operation
4.7.3 Printing and Dyeing Auxiliary Business
4.8 Shanghai Daxiang Chemical Industry Co., Ltd.
4.8.1 Profile
4.8.2 Operation
4.8.3 Printing and Dyeing Auxiliary Business
4.9 Zhejiang Hongda Chemicals Co., Ltd.
5 Major Chinese Printing and Dyeing Enterprises
5.1 Zhejiang Hangmin Co., Ltd.
5.1.1 Profile
5.1.2 Operation
5.1.3 Revenue Structure
5.1.4 Gross Margin
5.1.5 Customers
5.1.6 Printing and Dyeing Business
5.1.7 Forecast and Prospect
5.2 Zhonghe Co., Ltd.
5.2.1 Profile
5.2.2 Operation
5.2.3 Revenue Structure
5.2.4 Gross Margin
5.2.5 Customers
5.2.6 Printing and Dyeing Business
5.2.7 Forecast and Prospect
5.3 Jiangsu Sanfangxiang Industry Co., Ltd.
5.3.1 Profile
5.3.2 Operation
5.3.3 Revenue Structure
5.3.4 Gross Margin
5.3.5 Customers
5.3.6 Printing and Dyeing Business
5.3.7 Forecast and Prospect
6 Forecast and Prospect
6.1 Printing and Dyeing Auxiliary Industry
6.1.1 Development Trend
6.1.2 Operation of Enterprises
6.1.3 Supply and Demand
6.2 Printing and Dyeing Industry
6.2.1 Development Trend
6.2.2 Operation of Enterprises
6.2.3 Supply
表:纺织助剂分类及主要产品
表:印染助剂主要产品及其作用
图:印染助剂产业链
图:2005-2014年中国规模以上化学试剂和助剂制造企业数量
图:2005-2014年中国化学试剂和助剂制造企业营业收入及利润
图:2005-2014年中国化学试剂和助剂制造企业毛利率
图:2013年中国纺织助剂主要品种及其产量占比
图:2006-2013年中国印染助剂产量及同比增长率
表:2013年中国印染助剂行业主要企业及其产能
图:2008-2014年中国纺织助剂进出口量
图:2008-2014年中国纺织助剂进出口平均价格
图:2013年中国纺织助剂进口来源结构(按进口量)
图:2013年中国纺织助剂出口目的地分布(按出口量)
图:2013年中国纺织助剂主要进口地区及其进口量占比
图:2013年中国纺织助剂主要出口地区及其出口量占比
图:2006-2014年中国印染行业规模以上企业主营业务收入及利润
图:2013年中国印染行业规模以上企业(分产品)营收占比
图:2006-2014年中国印染行业规模以上企业利润率
图:2006-2014年中国印染行业规模以上企业亏损企业占比
图:2006-2014年中国印染布产量及增长率
图:2007-2014年中国印染布(分地区)产量占比
表:2008-2014年中国印染行业投资情况
图:2010-2014年中国印染行业产能淘汰任务量及完成量
图:2008-2014年中国印染产品出口量、金额及平均价格
表:2008-2014年中国印染产品(分产品)出口量占比
图:2013年中国印染产品(分地区)出口量占比
表:2013年中国印染产品出口目的地分析
图:2008-2014年传化股份营业收入和净利润
表:2008-2014年传化股份(分地区)主营收入占比
表:2008-2014年传化股份(分地区)营业收入
表:传化股份产品系列
图:2008-2014年传化股份(分产品)主营收入占比
表:2008-2014年传化股份(分产品)营业收入
图:2008-2014年传化股份综合毛利率
图:2008-2014年传化股份主营产品毛利率
表:传化股份印染助剂产品分类
图:2008-2014年传化股份印染助剂产品营业收入及毛利率
表:2014H1传化股份印染助剂相关子公司及其主营业务
表:2014H1传化股份印染助剂相关子公司营业收入及净利润
图:2014-2017年传化股份营业收入及净利润预测
图:2008-2012年德美化工营业收入及净利润
表:2008-2014年德美化工(分地区)主营收入占比
表:2008-2014年德美化工(分地区)营业收入
表:2008-2014年德美化工(分产品)主营收入占比
图:2008-2014年德美化工(分产品)营业收入
图:2008-2014年德美化工综合毛利率
图:2008-2014年德美化工主营产品毛利率
表:德美化工印染助剂产品
图:2014-2017年德美化工营业收入及净利润预测
图:2008-2014年浙江龙盛营业收入及净利润
表:2008-2014年浙江龙盛(分地区)主营收入占比
图:2008-2014年浙江龙盛(分地区)营业收入
表:浙江龙盛主营业务
表:2008-2014年浙江龙盛(分产品)主营收入占比
表:2008-2014年浙江龙盛(分产品)营业收入
图:2008-2014年浙江龙盛综合毛利率
表:2008-2014年浙江龙盛(分产品)毛利率
图:2014-2017年浙江龙盛营业收入及净利润预测
图:2008-2014年闰土股份营业收入及净利润
图:2008-2014年闰土股份(分地区)主营收入占比
图:2008-2014年闰土股份(分地区)营业收入
表:闰土股份主营业务及产品
图:2008-2014年闰土股份(分产品)营业收入占比
表:2008-2014年闰土股份(分产品)营业收入
图:2008-2014年闰土股份综合毛利率
表:2008-2014年闰土股份主营产品毛利率
图:2014-2017年闰土股份营业收入及净利润预测
图:2008-2014年安诺其营业收入及净利润
图:2008-2014年安诺其(分地区)主营收入占比
表:2008-2014年安诺其(分地区)营业收入
表:安诺其主营业务及产品
表:2010-2014年安诺其(分产品)主营收入占比
表:2010-2014年安诺其(分产品)营业收入
图:2008-2014年安诺其综合毛利率
表:2008-2014年安诺其(分地区)毛利率
表:2010-2014年安诺其(分产品)毛利率
表:2013年安诺其助剂相关子公司及其主营业务
图:2010-2013年烟台安诺其营业收入及净利润
图:2010-2013年东营安诺其营业收入及净利润
图:2012-2013年浙江安诺其营业收入及净利润
图:2014-2017年安诺其营业收入及净利润预测
表:2008-2009年恒星化工主营业务收入及利润总额
表:恒星化工印染助剂分类及产品
表:恒星化工印染助剂业务发展历程
表:2008-2009年美高化工主营业务收入及利润总额
表:美高化工印染助剂产品系列
表:2008-2009年大祥化工主营业务收入及利润总额
表:美高化工印染助剂产品系列
图:2008-2014年航民股份营业收入及净利润
图:2008-2014年航民股份(分地区)主营收入占比
图:2008-2014年航民股份(分地区)营业收入
表:2008-2014年航民股份(分产品)主营收入占比
表:2008-2014年航民股份(分产品)营业收入
图:2008-2014年航民股份综合毛利率
图:2008-2014年航民股份(分地区)毛利率
表:2008-2014年航民股份(分产品)毛利率
表:2014H1航民股份印染相关子公司销售收入及净利润
图:2014-2017年航民股份营业收入及净利润预测
图:2008-2014年众和股份营业收入及净利润
图:2008-2014年众和股份(分地区)主营收入占比
图:2008-2014年众和股份(分地区)营业收入
表:2008-2014年众和股份(分产品)主营收入占比
表:2008-2014年众和股份(分产品)营业收入
图:2008-2014年众和股份综合毛利率
表:2008-2014年众和股份(分产品)毛利率
图:2008-2014年众和股份前五名客户贡献收入及占比
图:2008-2014年众和股份印染业务收入及毛利率
图:2008-2014年厦门华印净利润及同比增速
图:2014-2017年众和股份营业收入及净利润预测
图:2008-2014年三房巷营业收入及净利润
图:2008-2014年三房巷(分地区)主营收入占比
图:2008-2014年三房巷(分地区)营业收入
表:2008-2014年三房巷(分产品)主营收入占比
表:2008-2014年三房巷(分产品)营业收入
图:2008-2014年三房巷综合毛利率
表:2008-2014年三房巷(分产品)毛利率
图:2008-2014年三房巷前五名客户贡献收入及占比
图:2010-2014年三房巷印染布及棉纱产量
图:2014-2017年三房巷营业收入及净利润预测
表:2014-2017年中国主要印染助剂企业营业收入预测
图:2014-2017年中国印染助剂产量预测
表:2014-2017年中国主要印染企业营业收入预测
图:2014-2017年中国印染布产量预测
Textile Auxiliary Classification and Main Products
Printing and Dyeing Auxiliary Products and Applications
Printing and Dyeing Auxiliary Industry Chain
Number of Chemical Reagent and Auxiliary Enterprises with the Annual Revenue of over RMB20 million, 2005-2014
Revenue and Profit of Chemical Reagent and Auxiliary Enterprises in China, 2005-2014
Gross Margin of Chemical Reagent and Auxiliary Enterprises in China, 2005-2014
Main Varieties and Output Structure of Chinese Textile Auxiliaries, 2013
China's Printing and Dyeing Auxiliary Output and YoY Growth Rate 2006-2013
Major Enterprises and Their Capacity in China Printing and Dyeing Auxiliary Industry, 2013
China's Textile Auxiliary Import and Export Volume, 2008-2014
Average Import and Export Prices of Chinese Textile Auxiliaries, 2008-2014
Import Source Structure of Chinese Textile Auxiliaries (by Import Volume), 2013
Export Destinations of Chinese Textile Auxiliaries (by Export Volume), 2013
Major Import Sources and Import Volume Structure of Chinese Textile Auxiliaries, 2013
Major Export Destinations and Export Volume Structure of Chinese Textile Auxiliaries, 2013
Operating Revenue and Profit of Enterprises with the Annual Revenue of over RMB20 million in China Printing and Dyeing Industry, 2006-2014
Revenue Structure of Enterprises with the Annual Revenue of over RMB20 million in China Printing and Dyeing Industry (by Product), 2013
Profit Margin of Enterprises with the Annual Revenue of over RMB20 million in China Printing and Dyeing Industry, 2006-2014
% of Loss-making Enterprises among Enterprises with the Annual Revenue of over RMB20 million in China Printing and Dyeing Industry, 2006-2014
China's Printing and Dyeing Fabric Output and Growth Rate, 2006-2014
China's Printing and Dyeing Fabric Output Structure (by Region), 2007-2014
Investment in China Printing and Dyeing Industry, 2008-2014
Capacity Elimination Goal and Eliminated Capacity of China Printing and Dyeing Industry, 2010-2014
Export Volume, Value and Average Price of Chinese Printing and Dyeing Products, 2008-2014
Export Structure of Chinese Printing and Dyeing Products (by Product), 2008-2014
Export Structure of Chinese Printing and Dyeing Products (by Region), 2013
Export Destinations of Chinese Printing and Dyeing Products, 2013
Revenue and Net Income of Zhejiang Transfar, 2008-2014
Operating Revenue Structure of Zhejiang Transfar (by Region), 2008-2014
Revenue of Zhejiang Transfar (by Region), 2008-2014
Product Series of Zhejiang Transfar
Operating Revenue Structure of Zhejiang Transfar (by Product), 2008-2014
Revenue of Zhejiang Transfar (by Product), 2008-2014
Consolidated Gross Margin of Zhejiang Transfar, 2008-2014
Gross Margin of Main Products of Zhejiang Transfar, 2008-2014
Printing and Dyeing Auxiliary Product Categories of Zhejiang Transfar
Revenue and Gross Margin of Printing and Dyeing Auxiliary Products of Zhejiang Transfar, 2008-2014
Printing and Dyeing Auxiliary Related Subsidiaries of Zhejiang Transfar and Their Main Business, H1 2014
Revenue and Net Income of Printing and Dyeing Auxiliary Related Subsidiaries of Zhejiang Transfar, H1 2014
Revenue and Net Income of Zhejiang Transfar, 2014-2017E
Revenue and Net Income of Dymatic Chemicals, 2008-2012
Operating Revenue Structure of Dymatic Chemicals (by Region), 2008-2014
Revenue of Dymatic Chemicals (by Region), 2008-2014
Operating Revenue Structure of Dymatic Chemicals (by Product), 2008-2014
Revenue of Dymatic Chemicals (by Product), 2008-2014
Consolidated Gross Margin of Dymatic Chemicals, 2008-2014
Gross Margin of Main Products of Dymatic Chemicals, 2008-2014
Printing and Dyeing Auxiliary Products of Dymatic Chemicals
Revenue and Net Income of Dymatic Chemicals, 2014-2017E
Revenue and Net Income of Zhejiang Longsheng, 2008-2014
Operating Revenue Structure of Zhejiang Longsheng (by Region), 2008-2014
Revenue of Zhejiang Longsheng (by Region), 2008-2014
Main Business of Zhejiang Longsheng
Operating Revenue Structure of Zhejiang Longsheng (by Product), 2008-2014
Revenue of Zhejiang Longsheng (by Product), 2008-2014
Consolidated Gross Margin of Zhejiang Longsheng, 2008-2014
Gross Margin of Zhejiang Longsheng (by Product), 2008-2014
Revenue and Net Income of Zhejiang Longsheng, 2014-2017E
Revenue and Net Income of Zhejiang Runtu, 2008-2014
Operating Revenue Structure of Zhejiang Runtu (by Region), 2008-2014
Revenue of Zhejiang Runtu (by Region), 2008-2014
Main Business and Products of Zhejiang Runtu
Revenue Structure of Zhejiang Runtu (by Product), 2008-2014
Revenue of Zhejiang Runtu (by Product), 2008-2014
Consolidated Gross Margin of Zhejiang Runtu, 2008-2014
Gross Margin of Main Products of Zhejiang Runtu, 2008-2014
Revenue and Net Income of Zhejiang Runtu, 2014-2017E
Revenue and Net Income of Anoky, 2008-2014
Operating Revenue Structure of Anoky (by Region), 2008-2014
Revenue of Anoky (by Region), 2008-2014
Main Business and Products of Anoky
Operating Revenue Structure of Anoky (by Product), 2010-2014
Revenue of Anoky (by Product), 2010-2014
Consolidated Gross Margin of Anoky, 2008-2014
Gross Margin of Anoky (by Region), 2008-2014
Gross Margin of Anoky (by Product), 2010-2014
Auxiliary Related Subsidiaries of Anoky and Their Main Business, 2013
Revenue and Net Income of Yantai Anoky, 2010-2013
Revenue and Net Income of Dongying Anoky, 2010-2013
Revenue and Net Income of Zhejiang Anoky, 2012-2013
Revenue and Net Income of Anoky, 2014-2017E
Operating Revenue and Gross Profit of Sunichem, 2008-2009
Printing and Dyeing Auxiliary Categories and Products of Sunichem
Printing and Dyeing Auxiliary Business Development Course of Sunichem
Operating Revenue and Gross Profit of Meigao Huayi Chemical, 2008-2009
Printing and Dyeing Auxiliary Product Series of Meigao Huayi Chemical
Operating Revenue and Gross Profit of Daxiang Chemical Industry, 2008-2009
Printing and Dyeing Auxiliary Series of Meigao Huayi Chemical
Revenue and Net Income of Zhejiang Hangmin, 2008-2014
Operating Revenue Structure of Zhejiang Hangmin (by Region), 2008-2014
Revenue of Zhejiang Hangmin (by Region), 2008-2014
Operating Revenue Structure of Zhejiang Hangmin (by Product), 2008-2014
Revenue of Zhejiang Hangmin (by Product), 2008-2014
Consolidated Gross Margin of Zhejiang Hangmin, 2008-2014
Gross Margin of Zhejiang Hangmin (by Region), 2008-2014
Gross Margin of Zhejiang Hangmin (by Product), 2008-2014
Revenue and Net Income of Printing and Dyeing Auxiliary Related Subsidiaries of Zhejiang Hangmin, H1 2014
Revenue and Net Income of Zhejiang Hangmin, 2014-2017E
Revenue and Net Income of Zhonghe, 2008-2014
Operating Revenue Structure of Zhonghe (by Region), 2008-2014
Revenue of Zhonghe (by Region), 2008-2014
Operating Revenue Structure of Zhonghe (by Product), 2008-2014
Revenue of Zhonghe (by Product), 2008-2014
Consolidated Gross Margin of Zhonghe, 2008-2014
Gross Margin of Zhonghe (by Product), 2008-2014
Revenue of Zhonghe from Top 5 Clients and% of Total Revenue, 2008-2014
Printing and Dyeing Revenue and Gross Margin of Zhonghe, 2008-2014
Net Income and YoY Growth Rate of Xiamen Huafang Printing and Dyeing Co., Ltd., 2008-2014
Revenue and Net Income of Zhonghe, 2014-2017E
Revenue and Net Income of Jiangsu Sanfangxiang Industry, 2008-2014
Operating Revenue Structure of Jiangsu Sanfangxiang Industry (by Region), 2008-2014
Revenue of Jiangsu Sanfangxiang Industry (by Region), 2008-2014
Operating Revenue Structure of Jiangsu Sanfangxiang Industry (by Product), 2008-2014
Revenue of Jiangsu Sanfangxiang Industry (by Product), 2008-2014
Consolidated Gross Margin of Jiangsu Sanfangxiang Industry, 2008-2014
Gross Margin of Jiangsu Sanfangxiang Industry (by Product), 2008-2014
Revenue of Jiangsu Sanfangxiang Industry from Top 5 Clients and% of Total Revenue, 2008-2014
Printing and Dyeing Fabric and Yarn Output of Jiangsu Sanfangxiang Industry, 2010-2014
Revenue and Net Income of Jiangsu Sanfangxiang Industry, 2014-2017E
Revenue of Major Printing and Dyeing Auxiliary Enterprises in China, 2014-2017E
China's Printing and Dyeing Auxiliary Output, 2014-2017E
Revenue of Major Printing and Dyeing Enterprises in China, 2014-2017E
China's Printing and Dyeing Fabric Output, 2014-2017E
如果这份报告不能满足您的要求,我们还可以为您定制报告,请 留言说明您的详细需求。
|