|
|
|
报告导航:研究报告—
TMT产业—电子半导体
|
|
2013-2014年全球及中国耳机行业研究报告 |
 |
字数:1.5万 |
页数:85 |
图表数:88 |
|
中文电子版:7500元 |
中文纸版:3750元 |
中文(电子+纸)版:8000元 |
|
英文电子版:2000美元 |
英文纸版:2100美元 |
英文(电子+纸)版:2300美元 |
|
编号:ZYW186
|
发布日期:2014-10 |
附件:下载 |
 |
|
|
《2013-2014年全球及中国耳机行业研究报告》包含以下内容:
1、耳机简介
2、耳机市场分析
3、耳机产业分析
4、8家品牌耳机厂家研究
5、13家耳机代工厂家研究
本报告研究范围包括Headphone、earphone、Headset。
全球耳机市场在2014年出货量规模预计3.06亿部,同比增长12.5%。按金额算,2014年全球耳机市场大约66亿美元,同比增长11.9%。耳机市场可以分为蓝牙通讯类、运动耳机耳塞(Earphone)、OCC(Office Call Center)、游戏用耳机耳塞(Earphone)、HiFi类耳机和一般类(Normal)。
一般类耳机价格平均价格不超过2美元,而高档耳机可达300美元。Plantronics和GN Netcom专注于OCC市场,Beats主打Pop市场,Skullcandy主打运动市场,Turtle Beach(VTB)和Razer主打游戏市场,三星、LG、Motorola主打通讯蓝牙市场。Logitech主打PC市场。老牌厂家如Sennheiser、AKG则关注HiFi市场。
苹果与三星Galaxy高价手机的流行彻底改变了耳机市场,手机成为年轻人生活的中心,人们愿意花300美元买个高档耳机。而高档耳机也从音乐爱好者的小众市场扩大到年轻人这个大众市场。众多品牌纷纷开拓高端市场。
Beats的出现彻底改变了耳机产业,Beats自2008年成立,不到10年就打败所有老牌耳机厂家成为全球第一,Beats所依靠不是耳机的音质或高性价比,而是依靠夸张的低音,铺天盖地的广告和花哨的外观。这就刺激众多毫无声学背景的厂家蜂拥进入此领域。
耳机产业都是OEM方式生产,且95%集中在中国大陆,中国大陆有着众多的耳机代工厂家。耳机行业毛利率极高,品牌耳机厂家毛利率都在50%以上,即便生产厂家毛利率也不低于10%。尽管毛利率高,品牌耳机厂家的市场营销费用开支却很大,渠道成本也非常高,这导致厂家营业利润很低,也让品牌厂家不得不把所有精力都放在市场上,而把产品都交给代工厂生产。
Global and China Earphone Industry Report, 2013-2014 focuses on the following:
1. Earphone overview
2. Earphone market
3. Earphone industry
4. 8 branded earphone vendors
5. 13 earphone OEMs
The report covers headphone, earphone and headset.
Global earphone shipments are estimated to reach 306 million in 2014, up 12.5% year on year, equaling about USD 6.6 billion by value, up 11.9% from a year earlier. The earphone can be divided into Bluetooth communications, sports earphone, OCC (Office Call Center), gaming earphone, HiFi earphone and normal earphone.
The average price of normal earphone is usually no more than USD 2, while high-end earphone could be worth USD 300. Plantronics and GN Netcom concentrate on OCC, Beats focuses on Pop, Skullcandy dominates sports, Turtle Beach (VTB) and Razer on gaming, while Samsung, LG and Motorola pull attention to Bluetooth communications, Logitech devotes to PC, and established companies like Sennheiser and AKG dedicate to HiFi.
The popularity of high-priced Apple and Samsung’s Galaxy revolutionized earphone market. As mobile phone has become the center of the young people’s life, they are willing to spend USD 300 to buy premium earphones, which have expanded from small niche market of music lovers to mass market of the youth, attracting many brands into the market.
The emergence of Beats radically changed earphone industry. Since the establishment in 2008, Beats defeated all established earphone companies in less than 10 years to put itself on the throne globally. The success of Beats depends not on acoustic fidelity or high price/performance ratio, but exaggerated bass, overwhelming ads and fancy appearance. This stimulated many companies without acoustic background to swarm into the field.
The earphones are manufactured in the form of OEM, and 95% of production is concentrated in mainland China, where a large number of earphone OEMs are located. The gross margin of earphone industry is extremely high, above 50% for branded earphone companies, and no less than 10% for manufacturers. Despite a high gross margin, the marketing expenditure of branded earphone companies is very large, as well as channel cost, resulting in a very low operating profit, which makes brand vendors focus on the market and contract the production to earphone manufacturers.
第一章、耳机简介
1.1、耳机分类
1.2、耳机参数简介
第二章、耳机下游市场
2.1、全球手机市场
2.2、全球智能手机市场
2.3、中国手机市场
2.4、平板电脑市场
2.5、笔记本电脑市场
2.6、台式机市场
2.7、中国耳机市场研究
2.7.1、中国耳机市场品牌格局
2.7.2、产品分析
2.7.3、价格分析
第三章、耳机产业
3.1、耳机市场规模
3.2、耳机市场占有率
3.3、品牌厂家与OEM厂家代工关系
3.4、耳机厂家排名
第四章、品牌耳机厂家研究
4.1、Logitech
4.2、GN Netcom
4.3、Beats
4.4、Skullcandy
4.5、VTB
4.6、Sennheiser
4.7、Audio-Technica
4.8、缤特力Plantronics
第五章、耳机代工厂家研究
5.1、富士高Fujikon
5.2、美律Merry
5.3、歌尔声学Goertek
5.4、CRESYN
5.5、三富电子Bluecom
5.6、Foster
5.7、正崴Foxlink
5.8、大东骏通
5.9、佳禾声学
5.10、达音科技
5.11、易力达集团
5.12、奥凯华科
1. Earphone Overview
1.1 Classification of Earphone
1.2 Overview of Earphone Parameters
2. Downstream Market of Earphone
2.1 Global Mobile Phone Market
2.2 Global Smartphone Market
2.3 Chinese Mobile Phone Market
2.4 Tablet PC Market
2.5 Laptop Computer Market
2.6 Desktop Computer Market
2.7 Chinese Earphone Market
2.7.1 China’s Earphone Brand Layout
2.7.2 Product
2.7.3 Price
3. Earphone Industry
3.1 Earphone Market Size
3.2 Earphone Market Share
3.3 Relation between Brand Vendors and OEMs
3.4 Ranking of Earphone Vendors
4. Branded Earphone Vendors
4.1 Logitech
4.2 GN Netcom
4.3 Beats
4.4 Skullcandy
4.5 VTB
4.6 Sennheiser
4.7 Audio-Technica
4.8 Plantronics
5. Earphone OEMs
5.1 Fujikon
5.2 Merry
5.3 GoerTek
5.4 CRESYN
5.5 Bluecom
5.6 Foster
5.7 Foxlink
5.8 Z.D.L
5.9 Cosonic
5.10 Dunu
5.11 Innovation Technology
5.12 OCVACO
2007-2015年全球手机出货量
2011-2014年全球3G/4G手机出货量地域分布
Worldwide Mobile Phone Sales to End Users by Vendor in 2013 (Thousands of Units)
Worldwide Smartphone Sales to End Users by Vendor in 2013 (Thousands of Units)
Worldwide Smartphone Sales to End Users by Operating System in 2013 (Thousands of Units)
2013-2015年全球Top 13智能手机厂家出货量
2014年1-8月中国手机月度出货量
2011-2016年全球平板电脑出货量
2013年平板电脑主要品牌市场占有率
2012、2013年全球平板电脑制造厂家产量
2008-2015年笔记本电脑出货量
2010-2013年全球主要笔记本电脑ODM厂家出货量
2008-2015年Desktop PC出货量
Top 5 Vendors, Worldwide PC Shipments, Fourth Quarter 2013
Top 5 Vendors, Worldwide PC Shipments 2013
2012-2018年全球耳机市场出货量
2012-2018年全球耳机市场规模
2014年全球耳机市场类型分布
2014年OCC Headsets主要厂家市场占有率
2014年Communications Bluetooth Headsets主要厂家市场占有率
2014年Headphones市场主要厂家市场占有率(出货量)
2014年Headphones市场主要厂家市场占有率(金额)
2014年Logitech Outsourcing厂家比例
2014年GN Netcom Outsourcing厂家比例
2014年Beats Outsourcing厂家比例
2014 SKULLCANDY Outsourcing厂家比例
2014 AKG Outsourcing厂家比例
2014 SONY Outsourcing厂家比例
2014 Sennheiser Outsourcing厂家比例
2014 Plantronics Outsourcing厂家比例
2014 philips Outsourcing厂家比例
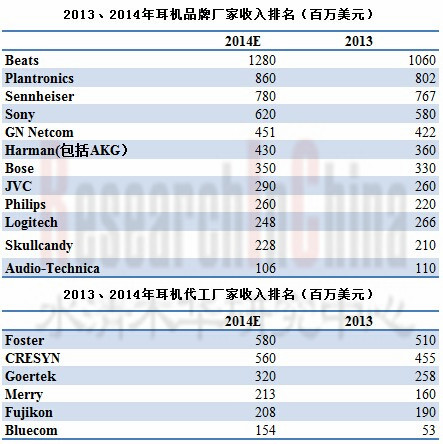
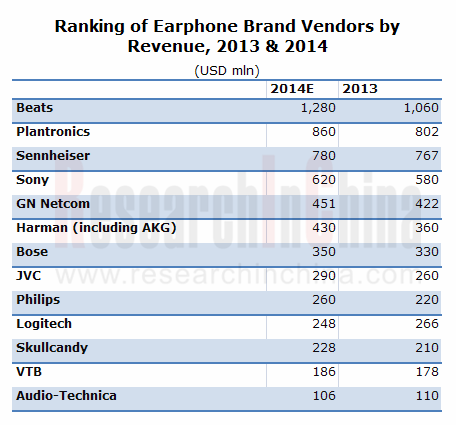
2013、2014年耳机品牌厂家收入排名
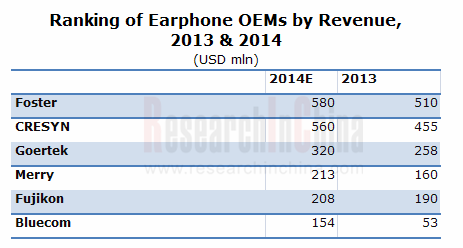
2013、2014年耳机代工厂家收入排名
FY2006-FY2015 罗技收入、毛利率和营业利润率
FY2011-FY2014 罗技收入业务分布
FY2011-FY2014 罗技Net retail sales by product categories
GN store nord组织结构
GN store nord 2013年收入业务分布
GN store nord 2013年收入地域分布
2009-2014 GN store nord收入、毛利率与营业利润率
2009-2014 GN resound收入、毛利率与营业利润率
2009-2014 GN Netcom收入、毛利率与营业利润率
2009-2014 GN Netcom收入业务分布
Beats组织结构
2008-2013年Beats收入
2013-2018年Beats收入
Beats SWOT分析
2009-2014 Skullcandy收入、毛利与营业利润
2012年1季度-2014年2季度 Skullcandy季度收入与净利润
2014年2季度 Skullcandy CONSOLIDATED BALANCE SHEETS
2011-2014 VTBH收入、毛利和营业利润
2014年2季度VTBH资产负债表
2009-2013年Sennheiser收入
2011-2013年Sennheiser收入地域分布
2013年Sennheiser收入业务分布
2009-2013年Sennheiser员工数量
2012-2013年Sennheiser Assets
2012-2013年Sennheiser Liabilities
2012-2013年Sennheiser Profits
FY2004-FY2014 Audio-Technica销售额
FY2014 Audio-Technica收入产品分布
2006-2015财年缤特力收入与营业利润率
2013年2季度-2014年2季度 Plantronics毛利率
2012财年-2014财年缤特力收入地域分布
2011财年-2014财年缤特力收入业务分布
FY2010-FY2015 富士高收入与毛利率
FY2010-FY2015 富士高收入与营业利润率
FY2010-FY2014 富士高资产负债表
FY2010-FY2014 富士高收入业务分布
Merry Electronics Organization Chart
MERRY Organization and Operation
2004-2014年美律收入与营业利润率
2007-2014年美律收入与毛利率
2012年8月-2014年8月美律每月收入与增幅
2005-2014年美律收入产品分布
2010-2013年美律各项产品产量
2006-2013年美律客户分布
2014年Merry收入客户分布
2012年美律大陆子公司简要财务数据
2006-2014年歌尔声学收入与营业利润率
2013年歌尔声学前五大客户
2009年1季度-2014年2季度Goertek季度收入
2009年1季度-2014年2季度Goertek毛利率和净利率
2009年1季度-2014年2季度Goertek库存周转天数
2013年CRESYN主要子公司财务数据
Bluecom组织结构
2007-2014年Bluecom收入营业利润率
2006-2014年Bluecom收入产品分布
2006-2012年Bluecom收入客户分布
2012-2014年上半年Bluecom成本结构
天津三富各种产品产能
2008-2010年3季度天津三富收入与利润
2006-2015财年Foster收入与营业利润率
2009-2012财年Foster收入地域分布
FY2010-FY2014财年Foster收入业务分布
正崴组织结构
2013年富港电子(东莞)有限公司简明财务
佳禾声学组织结构
Global Mobile Phone Shipments, 2007-2015E
Global 3G/4G Mobile Phone Shipments by Region, 2011-2014
Global Mobile Phone Sales to End Users by Vendor in 2013
Global Smartphone Sales to End Users by Vendor in 2013
Global Smartphone Sales to End Users by Operating System in 2013
Shipments of Global Top 13 Smartphone Vendors, 2013-2015E
Monthly Mobile Phone Shipments in China, Jan.-Aug. 2014
Global Tablet PC Shipments, 2011-2016E
Market Share of Main Tablet PC Brands, 2013
Number of Global Tablet PC Manufacturers, 2012 & 2013
Laptop Computer Shipments, 2008-2015E
Shipments of Major Global Laptop Computer ODMs, 2010-2013
Shipments of Desktop PC, 2008-2015E
Global Top5 PC Vendors by Shipments, Q4 2013
Global Top5 PC Vendors by Shipments, 2013
Global Earphone Shipments, 2012-2018E
Global Earphone Market Size, 2012-2018E
Global Earphone Market Distribution by Type, 2014
Market Share of Major OCC Headset Vendors, 2014
Market Share of Major Communications Bluetooth Headset Vendors, 2014
Market Share of Major Vendors in Headphone Market (Shipments), 2014
Market Share of Major Vendors in Headphone Market (Value), 2014
Structure of Outsourcing Manufacturers of Logitech, 2014
Structure of Outsourcing Manufacturers of GN Netcom, 2014
Structure of Outsourcing Manufacturers of Beats, 2014
Structure of Outsourcing Manufacturers of SKULLCANDY, 2014
Structure of Outsourcing Manufacturers of AKG, 2014
Structure of Outsourcing Manufacturers of Sony, 2014
Structure of Outsourcing Manufacturers of Sennheiser, 2014
Structure of Outsourcing Manufacturers of Plantronics, 2014
Structure of Outsourcing Manufacturers of Philips, 2014
Ranking of Earphone Brand Companies by Revenue, 2013 & 2014
Ranking of Earphone OEMs by Revenue, 2013 & 2014
Revenue, Gross Margin and Operating Margin of Logitech, FY2006-FY2015
Revenue Breakdown of Logitech by Business, FY2011-FY2014
Net Retail Sales of Logitech by Product Category, FY2011-FY2014
Organizational Structure of GN Store Nord
Revenue Breakdown of GN Store Nord by Business, 2013
Revenue Breakdown of GN Store Nord by Region, 2013
Revenue, Gross Margin and Operating Margin of GN Store Nord, 2009-2014
Revenue, Gross Margin and Operating Margin of GN ReSound, 2009-2014
Revenue, Gross Margin and Operating Margin of GN Netcom, 2009-2014
Revenue Breakdown of GN Netcom by Business, 2009-2014
Organizational Structure of Beats
Revenue of Beats, 2008-2013
Revenue of Beats, 2013-2018E
SWOT of Beats
Revenue, Gross Profit and Operating Income of Skullcandy, 2009-2014
Quarterly Revenue and Net Income of Skullcandy, Q1 2012-Q2 2014
Consolidated Balance Sheets of Skullcandy, Q2 2014
Revenue, Gross Profit and Operating Income of VTBH, 2011-2014
Balance Sheet of VTBH, Q2 2014
Revenue of Sennheiser, 2009-2013
Revenue Breakdown of Sennheiser by Region, 2011-2013
Revenue Breakdown of Sennheiser by Business, 2013
Number of Employees of Sennheiser, 2009-2013
Assets of Sennheiser, 2012-2013
Liabilities of Sennheiser, 2012-2013
Profit of Sennheiser, 2012-2013
Revenue of Audio-Technica, FY2004-FY2014
Revenue Breakdown of Audio-Technica, FY2014
Revenue and Operating Margin of Plantronics, FY2006-FY2015
Gross Margin of Plantronics, Q2 2013-Q2 2014
Revenue Breakdown of Plantronics by Region, FY2012-FY2014
Revenue Breakdown of Plantronics by Business, FY2011-FY2014
Revenue and Gross Margin of Fujikon, FY2010-FY2015E
Revenue and Operating Margin of Fujikon, FY2010-FY2015E
Balance Sheet of Fujikon, FY2010-FY2014
Revenue Breakdown of Fujikon by Business, FY2010-FY2014
Organization Chart of Merry
Organization and Operation of Merry
Revenue and Operating Margin of Merry, 2004-2014
Revenue and Gross Margin of Merry, 2007-2014
Monthly Revenue and Growth Rate of Merry, Aug. 2012-Aug. 2014
Revenue Breakdown of Merry by Product, 2005-2014
Output of Merry’s Products, 2010-2013
Customer Structure of Merry, 2006-2013
Revenue Breakdown of Merry by Customer, 2014
Snapshot of Financial Data of Merry’s Mainland Chinese Subsidiaries, 2012
Revenue and Operating Margin of GoerTek, 2006-2014
Top5 Customers of GoerTek, 2013
Quarterly Revenue of GoerTek, Q1 2009-Q2 2014
Gross Margin and Net Profit Margin of GoerTek, Q1 2009-Q2 2014
Stock turnover of GoerTek, Q1 2009-Q2 2014
Financial Data of CRESYN’s Major Subsidiaries, 2013
Organizational Structure of Bluecom
Revenue and Operating Margin of Bluecom, 2007-2014
Revenue Breakdown of Bluecom by Product, 2006-2014
Revenue Breakdown of Bluecom by Customer, 2006-2012
Cost Structure of Bluecom, 2012-2014 H1
Capacities of Tianjin Sanfu Electronics’ Products
Revenue and Profit of Tianjin Sanfu Electronics, 2008-Q3 2010
Revenue and Operating Margin of Foster, FY2006-FY2015E
Revenue Breakdown of Foster by Region, FY2009-FY2012
Revenue Breakdown of Foster by Business, FY2009-FY2014
Organizational Structure of Foxlink
Snapshot of Financial Affairs of Fugang Electronic (Dongguan), 2013
Organizational Structure of Cosonic
如果这份报告不能满足您的要求,我们还可以为您定制报告,请 留言说明您的详细需求。
|