|
|
|
报告导航:研究报告—
金融与服务业—教育培训
|
|
2014-2017年中国教育与培训行业研究报告 |
 |
字数:3.8万 |
页数:180 |
图表数:214 |
|
中文电子版:8000元 |
中文纸版:4000元 |
中文(电子+纸)版:8500元 |
|
英文电子版:2400美元 |
英文纸版:2600美元 |
英文(电子+纸)版:2700美元 |
|
编号:WLQ022
|
发布日期:2014-10 |
附件:下载 |
 |
|
|
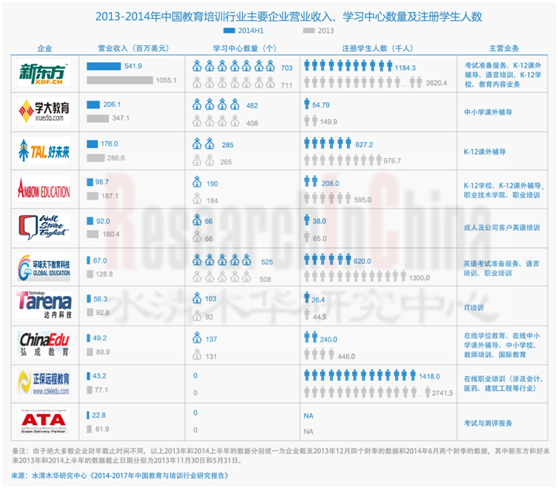
2013-2014年,中国教育培训行业呈现如下特点:
1, 教育培训机构多,但大型企业较少。
截至2013年底,中国共有教育培训机构11.23万所,但收入规模超过10亿元的企业屈指可数。营业收入较高企业有新东方、学大教育、好未来等,2013年三者营业收入分别为1,0.55亿美元(64.37亿元)、3.47亿美元(21.16亿元)、2.87亿美元(17.64亿元)。绝大多数企业营收低于10亿元。
2,竞争加剧,综合实力较弱培训机构被兼并收购或退出市场。
2003-2013年,中国教育培训机构数量从23.06万所下降到11.23万所,下降了51.3%。其中,培训质量较高,综合实力较强的大型培训机构树立了品牌,赢得了市场和消费者的认可,不断扩张学习中心,如学大教育学习中心数量从2007年的32个增加到2014上半年的462个。
3民办教育政策环境进一步开放和完善。
中国政府鼓励和引导民间资金进入教育领域,并不断完善相关金融、税收政策。如,2013年3月,出台的《教育部关于2013年深化教育领域综合改革的意见》指出“出台鼓励和支持民办教育发展的意见,落实支持民办教育发展的政策措施,吸引社会资金进入教育领域”;《关于进一步鼓励社会力量兴办教育的若干意见》目前已经定稿,该文件涵盖了民办教育的诸多领域,包括分类管理、办学准入领域、办学筹资渠道、财政投入机制等。
4 职业教育上升为国家战略。
2014年6月,中国出台了《国务院关于加快发展现代职业教育的决定》和《现代职业教育体系建设规划(2014-2020年)》。该文件规划到2020年,大中型企业参与职业教育办学的比例达到80%以上。受政策推动,教育培训机构及企业纷纷布局职业教育。截至2014年9月底,在A股上市公司中,已经有26家企业布局职业教育。
5传统教育培训机构加大线上业务投入。
2013-2014年在线教育吸引了大量资本进入,互联网企业、投资公司、创业公司等纷纷布局在线教育。传统线下教育培训机构(新东方、好未来、学大教育、巨人教育、龙文教育、华图教育等)也加大线上业务布局力度,这些企业依托线下业务主要建立O2O的商业模式。如,新东方已经建立起依托于新东方网的混合学习平台、依托于新东方在线的智能化录播式在线学习平台、依托于酷学网的开放式直播在线教育平台,同时新东方与腾讯的合资公司微学明日正在移动学习领域探索。
《2014-2017年中国教育与培训行业研究报告》主要包括以下内容:
 中国各类教育学校、学生及培训机构发展情况(包括幼儿园、小学、初中、高中、高等教育、教育培训机构等); 中国各类教育学校、学生及培训机构发展情况(包括幼儿园、小学、初中、高中、高等教育、教育培训机构等);
教育与培训行业发展环境分析(包括教育资金投入、教育消费支出、国家中长期教育改革和发展规划(2010-2020年)等);
职业教育发展分析(包括概况、职业教育经费、中高等职业教育、行业政策、发展趋势等);
民办教育发展分析(相关政策,各类民办学校数量、学生人数及教职工等) 包括整体市场现状、市场规模,K-12教育、语言培训、职业培训等细分行业市场规模和竞争格局等;
教育培训行业11家重点企业分析(包括简介、经营情况、营收构成、学习中心、学生人数、发展战略等)。
In 2013-2014, China education and training industry is characterized as follows:
1, There are many education and training institutions but few large ones.
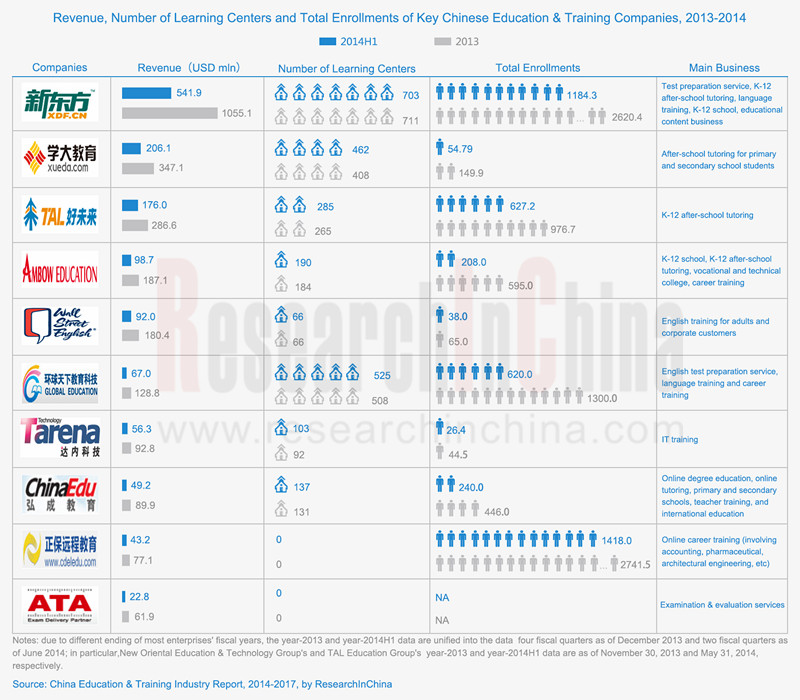
As of the end of 2013, China had boasted a total of 112,300 education & training institutions but few of them could achieve annual revenue of more than RMB1 billion. The companies with higher proceeds consist of New Oriental Education & Technology Group, Inc., Xueda Education, TAL Education Group, etc., and the three’s revenue in 2013 was respectively up to USD1.055 billion (RMB6.437 billion), USD347 million (RMB2.116 billion), and USD287 million (RMB1.764 billion). The overwhelm majority of companies sees their annual revenue of less than RMB1 billion.
2, Competition pricks up, and the training institutions with weak comprehensive strength are merged or exited the market.
During 2003-2013, the number of education & training institutions in China fell from 230,600 to 112,300, a sharp drop of 51.3%. It is worth noticing that large training organizations with better quality of training activities and more competitive strength established well-known brands and got highly recognized among consumers and in the market, thus ceaselessly expanding the learning centers, take example for Xueda education whose learning centers rose from 32 in 2007 to 462 in the first half of 2014.
3, Policy environment for private education gets better and further open.
Chinese Government encourages and guides private capital into the education sector and continuously consummates relevant financial and tax policies. For instance, in March, 2013, the Decision of the State Council on Accelerating the Development of Modern Vocational Education was issued, which pointed it out that “to release the opinions on encouraging and supporting the development of private education, to implement the policies and measures about the development of private education, and to attract social capital into education sector”. The draft of Several Opinions on Further Encouraging Social Forces to Run Education has been finalized for the moment, which covers many domains of private education such as classified management, school-running admission, school-running financing channel, financial investment mechanism, etc.
4, Vocational education rises as a national strategy.
In June, 2014, the State issued the Decision of the State Council on Accelerating the Development of Modern Vocational Education and the Modern Vocational Education System Construction Planning (2014-2020). Before 2020, the proportion of medium and large enterprises participating in running vocational education schools should be above 80%. Bolstered by policies, the education & training institutions and enterprises have successively set foot in vocational education. By the end of September, 2014, 26 listed companies in the A-share market have been involved in vocational education.
5, Traditional education and training institutions make more investment in online business.
In 2013-2014, online education attracted the massive inrush of capital, and internet firms, venture companies, startups and otherwise all have made arrangements in online education. Also, traditional offline education & training institutions (New Oriental Education & Technology Group, Inc., TAL Education Group, Xueda Education, Juren Education, Longwen Education, Huatu Education, etc.) made more efforts in online business and mainly built O2O model by dint of their offline business. For example, New Oriental Education & Technology Group, Inc. has established a blended learning platform by depending on XDF.cn, an intelligent recorded online learning platform by relying on koolearn.com, and an open live online education platform by dint of Koo.cn. Besides, Weixue Mingri, which is co-funded by New Oriental Education & Technology Group and Tencent is exploring mobile learning field.
China Education and Training Industry Report, 2014-2017 mainly deals with the following:
Development of various education schools, students and training institutions in China (including kindergarten, junior school, junior high school, high school, higher education, education & training institutions, etc.);
Development environment of education and training industry (involving education investment, education expenditure, National Medium- and Long-term Planning for Education Reform and Development (2010-2020);
Development of vocational education (covering overview, vocational education funds, secondary/higher vocational education, industry policy, development trend, etc.);
Development of private education (relevant policies, number of various private schools, enrolled students and faculties, etc.)
Education & Training industry analysis (including the status quo and scale of the market as well as the market size and competition pattern of market segments like K-12 education, language training and vocational training);
11 leading companies in education and training industry (including profile, operation, revenue structure, learning center, student enrollment, development strategy, etc.)
第一章 中国学校、学生及培训机构
1.1各类教育
1.1.1 幼儿园
1.1.2 义务教育
1.1.3 高中阶段教育
1.1.4 高等教育
1.1.5 成人培训与扫盲教育
1.2 各类学校及学生对比
1.2.1 学校数量
1.2.2 学生数量
1.3 教育培训机构
1.3.1 培训机构数量
1.3.2 学员及教职工
第二章 教育与培训行业发展环境分析
2.1 教育资金投入
2.2 教育消费支出
2.3 国家中长期教育改革和发展规划(2010-2020年)要点解读
2.3.1 教育事业改革发展的工作方针和战略目标及主题
2.3.2 教育事业发展的主要任务
2.3.3 在教育体制改革和制度创新方面的重大措施
2.3.4 教育规划设计的重大项目和改革试点
第三章 职业教育发展分析
3.1 概况及教育经费
3.1.1 概况
3.1.2 职业教育经费
3.2 中等职业教育
3.2.1 学校数量
3.2.2 学生人数
3.2.3 就业情况
3.2.4 教育资金投入
3.3 高等职业教育
3.3.1 学校数量
3.3.2 学生人数
3.3.3 就业情况
3.4 行业政策
3.4.1 政策概况
3.4.2 《关于加快发展现代职业教育的决定》
3.4.3 《现代职业教育体系建设规划(2014-2020年)》
3.4.4 《国务院关于深化考试招生制度改革的实施意见》
3.5发展趋势
3.5.1 产教进一步融合
3.5.2 建立学历证书和职业资格证书的双证书制度
3.5.3 将出现大的职业教育集团
3.5.4 民办职业教育政策环境进一步完善
3.5.5 中外合作办学项目进一步增加
第四章 民办教育发展分析
4.1 定义和分类
4.2 相关政策
4.3 民办学校、学生及教职工
4.3.1 民办学校
4.3.2 学生及教职工
4.4 民办幼儿园
4.4.1 幼儿园数量
4.4.2 学生数量
4.5 民办高等教育
4.5.1 民办高等教育概况
4.5.2 民办大学
4.5.3 独立学院
4.6 民办培训机构
4.6.1 机构数量
4.6.2 学员情况
第五章 教育培训整体及细分行业运行情况
5.1 定义和分类
5.2 市场现状及市场规模
5.2.1 市场现状
5.2.2 市场规模
5.3 K-12教育
5.3.1 学前教育
5.3.2 中小学教育
5.3.3 市场规模
5.3.4 竞争格局
5.4 语言培训
5.4.1 市场规模
5.4.2 竞争格局
5.5 职业培训
5.5.1 市场概况
5.5.2 市场规模
5.5.3 管理培训
5.5.4 IT培训
5.5.5 财会金融培训
5.5.6 建筑工程培训
5.6 在线教育
5.6.1 市场现状
5.6.2 市场规模
5.6.3 竞争格局
第六章 教育培训行业重点企业
6.1 新东方教育科技集团
6.1.1 公司简介
6.1.2 经营情况
6.1.3 营收构成
6.1.4 学习中心
6.1.5 学生人数
6.1.6 业务构成
6.1.7 营销模式
6.1.8 发展战略
6.2 学大教育集团
6.2.1 公司简介
6.2.2 经营情况
6.2.3 学习中心
6.2.4 学生及课程
6.2.5 发展战略
6.3 好未来教育集团有限公司
6.3.1 公司简介
6.3.2 经营情况
6.3.3 学习中心
6.3.4 学生人数
6.3.5 业务构成
6.3.6 学而思网校
6.3.7 发展战略
6.4 安博教育
6.4.1 公司简介
6.4.2 经营情况
6.4.3 营收构成
6.4.4 学习中心
6.4.5 学生人数
6.5 达内科技
6.5.1 公司简介
6.5.2 经营情况
6.5.3 学习中心及课程
6.5.4 学生人数
6.6 弘成教育集团
6.6.1 公司简介
6.6.2 经营情况
6.6.3 营收构成
6.6.4 毛利率
6.6.5 网点及学员情况
6.6.6 业务构成
6.6.7 经营模式与策略
6.6.8 最新动态
6.7 正保远程教育控股有限公司
6.7.1 公司简介
6.7.2 经营情况
6.7.3 营收构成
6.7.4 学员情况
6.7.5 商业模式
6.7.6 盈利模式
6.7.7 正保远程教育开放平台
6.7.8 经营战略
6.8 ATA公司
6.8.1 公司简介
6.8.2 经营情况
6.8.3 营收构成
6.8.4 经营模式与策略
6.8.5 与新东方成立在线教育公司
6.9 中国教育集团
6.9.1 公司简介
6.9.2 经营情况
6.9.3 营收构成
6.9.4 毛利率
6.10深圳市方直科技股份有限公司
6.10.1 公司简介
6.10.2 经营情况
6.10.3 营收构成
6.10.4 毛利率
6.10.5 前五大客户
6.10.6 经营策略
6.11英国培生集团
6.11.1 公司简介
6.11.2 经营情况
6.11.3 营收构成
6.11.4 在华业务
6.11.5 华尔街英语
6.11.6 环球教育
6.11.7 工作计划
1. Schools, Students and Training Institutions
1.1 Education by Type
1.1.1 Kindergartens
1.1.2 Compulsory Education
1.1.3 Senior Secondary Schools
1.1.4 Higher Education
1.1.5 Adult Training and Anti-Illiteracy Education
1.2 Number of Schools and Students
1.2.1 Number of Schools
1.2.2 Number of Students
1.3 Educational and Training Institutions
1.3.1 Number of Training Institutions
1.3.2 Students and Staff
2. Education & Training Development Environment
2.1 Investment in Education
2.2 Education Spending
2.3 Interpretation of National Medium-and Long-Term Education Reform and Development Planning (2010-2020)
2.3.1 Guidelines, Strategic Objectives and Subjects of Education Reform and Development
2.3.2 Major Tasks for Education Development
2.3.3 Major Measures of Reform of Educational System and Institution Innovation
2.3.4 Major Projects and Pilot Reforms of Education Planning
3. Development of Vocational Education
3.1 Profile and Education Funds
3.1.1 Profile
3.1.2 Vocational Education Funds
3.2 Secondary Vocational Education
3.2.1 Quantity of Schools
3.2.2 Number of Students
3.2.3 Employment Status
3.2.4 Investment of Vocational Education
3.3 Higher Vocational Education
3.3.1 Number of Schools
3.3.2 Number of Students
3.3.3 Employment
3.4 Industry Policy
3.4.1 Overview
3.4.2 Decision of the State Council on Accelerating the Development of Modern Vocational Education
3.4.3 Modern Vocational Education System Construction Planning (2014-2020)
3.4.4 The Implementation Opinions of the State Council on Deepening the Reform of Examination and Enrollment System
3.5 Development Trend
3.5.1 Production and Teaching Get Further Integrated
3.5.2 A Bi-certificate System of Academic Certificates and Vocational Qualification Certificate is to be Established
3.5.3 Large Vocational Education Groups will Emerge
3.5.4 Policy Environment for Private Vocational Education Gets Better
3.5.5 Sino-foreign School-running Projects will Rise Further
4. Development of Non-Government Funded Education
4.1 Definition and Classification
4.2 Policies on Non-Government Funded Education
4.3 Schools, Students and Staff
4.3.1 Private Schools by Type
4.3.2 Students and Staff
4.4 Private Kindergartens
4.4.1 Number of Private Kindergartens
4.4.2 Number of Students
4.5 Private Higher Education
4.5.1 Profile
4.5.2 Private Universities
4.5.3 Independent Institutions
4.6 Private Training Institutions
4.6.1 Number of Private Training Institutions
4.6.2 Students
5. Overall and Segmental Market of Education Training Industry
5.1 Definition and Classification
5.2 Market Status and Market Size
5.2.1 Market Status
5.2.2 Market Size
5.3 K-12 Education
5.3.1 Pre-school Education
5.3.2 Primary and Secondary School Education
5.3.3 Market Size
5.3.4 Competition Pattern
5.4 Language Training
5.4.1 Market Size
5.4.2 Competition Pattern
5.5 Vocational Training
5.5.1 Profile
5.5.2 Market Size
5.5.3 Management Training
5.5.4 IT Training
5.5.5 Training in Accounting and Finance
5.5.6 Construction Engineering Training
5.6 Online Education
5.6.1 Market Situation
5.6.2 Market Size
5.6.3 Competition Pattern
6. Key Enterprises in Education and Training Industry
6.1 New Oriental Education & Technology Group, Inc.
6.1.1 Profile
6.1.2 Operation
6.1.3 Revenue Structure
6.1.4 Learning Centers
6.1.5 Student Enrollments
6.1.6 Business Structure
6.1.7 Marketing Model
6.1.8 Development Strategy
6.2 Xueda Education
6.2.1 Profile
6.2.2 Operation
6.2.3 Learning Centers
6.2.4 Students and Courses
6.2.5 Development Strategy
6.3 TAL Education Group
6.3.1 Profile
6.3.2 Operation
6.3.3 Learning Centers
6.3.4 Number of Students
6.3.5 Business Structure
6.3.6 Xueersi.com
6.3.7 Development Strategy
6.4 Ambow Education Holding Ltd.
6.4.1 Profile
6.4.2 Operation
6.4.3 Revenue Structure
6.4.4 Learning Centers
6.4.5 Student Enrollments
6.5 Tarena International
6.5.1 Profile
6.5.2 Operation
6.5.3 Learning Centers and Courses
6.5.4 Student Enrollments
6.6 ChinaEdu Corporation
6.6.1 Profile
6.6.2 Operation
6.6.3 Revenue Structure
6.6.4 Gross Margin
6.6.5 Outlets and Trainees
6.6.6 Business Structure
6.6.7 Business Model and Strategy
6.6.8 Latest News
6.7 China Distance Education Holdings Ltd.
6.7.1 Profile
6.7.2 Operation
6.7.3 Revenue Structure
6.7.4 Student Enrollments
6.7.5 Business Model
6.7.6 Profit Model
6.7.7 Open Platform
6.7.8 Operation Strategy
6.8 ATA Inc.
6.8.1 Profile
6.8.2 Operation
6.8.3 Revenue Structure
6.8.4 Operation Pattern and Strategy
6.8.5 Online Education Company Co-established with New Oriental
6.9 China Education Alliance Inc.
6.9.1 Profile
6.9.2 Operation
6.9.3 Revenue Structure
6.9.4 Gross Margin
6.10 Shenzhen Kingsun Science & Technology
6.10.1 Profile
6.10.2 Operation
6.10.3 Revenue Structure
6.10.4 Gross Margin
6.10.5 Top Five Clients
6.10.6 Business Strategy
6.11 Pearson Group
6.11.1 Profile
6.11.2 Operation
6.11.3 Revenue Structure
6.11.4 Business in China
6.11.5 Wall Street English
6.11.6 Global Education
6.11.7 Work Plan
图:2003-2013年中国幼儿园数量及同比增长
图:2003-2013年中国幼儿园招生及在校生人数
图:2003-2013年中国小学学校数量及同比增长
图:2003-2013年中国小学招生、在校生和毕业生人数
图:2003-2013年中国初中数量及同比增长
图:2003-2013年中国初中学校招生、在校生、毕业生人数
表:2003-2013年中国高中阶段教育各类型学校数量变化趋势
图:2003-2013年中国普通高中招生、在校生、毕业人数变化趋势
图:2003-2013年中国成人高中在校生及毕业生人数
图:2003-2013年中国普通中专招生、在校生、毕业生人数
图:2003-2013年中国职业高中招生、在校生、毕业生人数
图:2003-2013年中国技工学校招生、在校生、毕业生人数
图:2003-2013年中国成人中专招生、在校生、毕业生人数
表:2003-2013年中国高等教育各类型学校数量
图:2003-2013年中国本科招生、在校生、毕业生人数
图:2003-2013年中国专科招生、在校生、毕业生人数
图:2003-2013年中国硕士招生、在校生、毕业生人数
图:2003-2013年中国博士招生、在校生、毕业生人数
图:2004-2013年中国成人本科和专科招生、在校生、毕业生人数
图:2008-2013年中国各类学校数量
图:2008-2013年中国各类学校招生人数
图:2008-2013年中国各类学校在校生人数
图:2008-2013年中国各类学校毕业生人数
图:2003-2013年中国教育培训机构数量及同比增长
图:2004-2013年中国教育培训机构数量构成(分类别)
图:2004-2013年中国农村成人文化技术培训机构数量及同比增长
图:2004-2013年中国职工技术培训机构数量及同比增长
图:其他培训机构(含社会培训机构)数量及同比增长
图:中国教育培训机构数量分布(分区域)
图:2004-2013年中国教育培训机构注册学生人数及同比增长
图:2004-2013年中国教育培训机构结业学生人数及同比增长
图:2004-2013年中国教育培训机构教职工人数及同比增长
图:2003-2013年中国教育资金总投入及同比增长
表:2011-2012年中国公共财政教育支出及其占公共财政支出的比例(分省市)
图:2003-2013年中国教育行业城镇固定资产投资及同比增长
图:2003-2013年城镇居民人均年度教育消费支出
表:2010-2020年中国教育事业发展主要目标
表:2010-2020年国家人力资源开发主要目标
表:2010-2020年中国教育事业发展的八项任务
表:2010-2020年中国教育体制改革和制度创新的重大措施
表:2010-2020年中国教育发展规划的10个重大项目和10个改革试点
图:2003-2013年中国中等职业教育学校数量及同比增长
图:2013vs.2003年中国中等职业教育学校数量构成(分类别)
表:2012年中国中等职业教育学校数量(分设立机构)
图:2003-2013年中国中等职业教育学校招生人数及同比增长
图:2013vs.2003中国中等职业教育学校招生人数构成(分类别)
图:2003-2013年中国中等职业教育在校生人数及同比增长
图:2013vs.2003年中国中等职业教育在校生人数构成(分类别)
表:2012年中国中等职业教育学校分科类招生、在校生和毕业生人数
图:2005-2013年中国中等职业教育学校毕业生就业率
图:2008-2013年中国中等职业教育学校毕业生就业去向构成
图:2008-2013年中国中等职业教育学校毕业生就业去向(分产业)
图:2008-2013年中国中等职业教育学校毕业生就业渠道构成
表:2006-2012年中国各地区中等职业教育生均公共财政预算教育事业费
图:2004-2013年中国高等职业教育学校数量及同比增长
图:2003-2013年中国高职高专院校招生人数及同比增长
图:2003-2013年中国高职高专院校在校生人数及同比增长
表:2012年中国高职高专院校招生、在校生和毕业生人数(分学科)
图:2007-2013年中国高职高专院校毕业生就业率
表:2012-2020年中国现代职业教育体系建设量化目标
表:中国职业教育重点发展领域(分行业)
表:1982-2014年中国民办教育相关政策
表:2008-2013年中国民办教育学校和培训机构数量
图:2008-2013年中国各类民办学校数量占比
表:2008-2013年中国各类民办教育学校招生人数
表:2008-2013年中国民办教育学校在校生人数
表:2008-2013年中国各类民办教育学校毕业生人数
表:2008-2013年中国各类民办教育学校及培训机构教职工人数
图:2003-2013年中国民办幼儿园数量及同比增长
图:2003-2013年中国民办幼儿园数量在总幼儿园数量中占比
图:2003-2013年中国民办幼儿园数量(分区域)
图:2008-2017年民办幼儿园招生人数及同比增长
图:2008-2017年中国民办幼儿园招生人数在幼儿园招生人数中占比
图:2008-2017年中国民办幼儿园在校生人数及同比增长
表:2013-2014中国民办大学Top20
图:2013-2014年中国民办大学Top100地域构成
表:2013-2014年中国Top20独立学院
图:2013-2014年中国Top100独立学院地域构成
图:2004-2013年中国民办培训机构数量及同比增长
图:2004-2013年中国民办培训机构数量(分类别)
图:2004-2013年中国民办培训机构注册学生人数及同比增长
图:2004-2013年中国民办培训机构注册学生人数(分类别)
表:教育培训行业分类
表:教育培训细分行业政策支持、市场需求、市场成熟度、进入门槛、资本关注的发展阶段
图:2008-2017年中国教育培训行业市场规模
表:学前教育主要模式、核心要素及代表企业
图:2008-2013年中国中小学在校生人数
图:2008-2017年中国K-12教育市场规模及同比增长
表:2013年中国中小学生课外辅导收入Top10企业及其市场份额
图:2008-2013年中国出国留学人数及同比增长
图:2008-2017年中国语言培训市场规模及同比增长
表:2013年中国Top10英语培训机构及其教学模式和培训对象
图:职业培训细分市场
图:2008-2017年中国职业培训市场规模及同比增长
图:2008-2017年中国IT培训市场规模及同比增长
图:2008-2017年中国在线教育用户数量及同比增长
图:2008-2017年中国在线教育市场规模及同比增长
图:2008-2017年中国在线教育在教育培训行业渗透率
表:2013年中国主要企业在线教育业务收入
图:2009-2014财年新东方营业收入及同比增长
图:2009-2014财年新东方净利润及同比增长
图:2009-2014财年新东方净利润率
图:2009-2014财年新东方营业收入(分季度)
图:2009-2014财年新东方营业收入(分业务和季度)
图:2009-2014财年新东方学校及学习中心数(分财季)
表:截至2014财年新东方学校及学习中心数量(分城市)
图:2009-2014财年新东方语言培训和考试辅导课程注册学生数(分财季)
图:2014财年新东方付费学生人数(分业务)
图:2011-2017财年新东方在线业务收入及同比增长
图:2009-2014财年新东方销售及市场推广费
图:新东方营销模式
图:学大教育服务模式
图:2011-2014年学大教育员工人数构成
图:2009-2014年学大教育营业收入及同比增长
图:2009-2014年学大教育净利润及同比增长
图:2009-2014年学大教育净利率
图:2007-2014年学大教育学习中心数量及同比增长
图:2009-2013年学大教育学习中线扩张路线图
图:截至2014年6月学大教育学习中心数量(分城市)
图:2007-2014年学大教育服务的学生人数及同比增长
图:2009-2013年学大教育平均每小时课程费及同比增长
图:学大教育基于云计算的家教平台
图:2014-2015年学大教育发展路线图
图:2009-2015财年好未来教育营业收入及同比增长
图:2009-2015财年好未来教育净利润及同比增长
图:2009-2015财年好未来教育净利率
图:2008-2015财年好未来学习中心数量及同比增长
图:截至2015财年第一财季好未来学习中心数量(分城市)
图:2009-2015财年好未来教育注册学生人数,同比增长及平均销售价格
图:学而思核心课程及主要业务
图:学而思服务模式
图:2011-2018财年学而思网校营业收入及同比增长
图:2003-2014年好未来在线教育布局
图:学而思在线教育产品(分学生年龄)
图:安博教育业务构成
图:2009-2013年安博教育营业收入及同比增长
图:2009-2013年安博教育净利润
图:2009-2013年安博教育净利率
图:2009-2013年安博教育营收构成(分业务)
表:2011-2013年安博教育营收构成(分部门)
图:安博教育学习中心分布(分省市)
图:2010-2013年安博教育注册学生人数(分部门)
图:达内科技公司结构
图:2011-2017年达内科技营业收入及同比增长
图:2011-2017年达内科技净利润及同比增长
图:2011-2017年达内科技净利率
图:2011-2014年达内科技毛利及毛利率
图:2011-2014年达内科技成本构成
图:截至2014年6月达内科技学习中心及课程(分城市)
图:达内科技学习中心扩张路线
图:达内科技课程扩张路线
图:2011-2014年达内科技注册学生人数(分招生渠道)
图:2012-2014年达内科技注册学生人数(分季度)
表:2011-2013年达内科技注册学生人数(分课程)
图:2011-2014年达内科技每个学生平均收入
图:2009-2013年弘成教育营业收入及同比增长
图:2009-2013年弘成教育净利润及同比增长
图:2009-2013年弘成教育净利率
图:2008-2012年弘成教育营业收入(分季度)
表:2009-2013年弘成教育营收构成(分业务和季度)
图:2009-2013年弘成教育毛利率(分业务)
图:2007-2013年弘成教育学习中心数
图:2009-2013年弘成教育在线学位项目学生人数(分季度)
表:弘成教育业务构成
图:2014-2017年弘成教育营业收入及同比增长
图:2009-2014财年正保远程教育营业收入及同比增长
图:2009-2014财年正保远程教育净利润及同比增长
图:2009-2014财年正保远程教育净利率
图:2009-2014财年正保远程教育营收构成(分财季)
表:2009-2014财年正保远程教育营收构成(分业务和财季)
表:2013财年正保远程教育在线教育业务收入构成(分课程)
图:2009-2014财年正保远程教育课程总录取人数及人均消费
图:2009-2014财年正保远程教育课程录取人数(分季度)
图:正保远程教育业务构成
图:正保远程教育课程形式
图:正保远程教育学员课程费支付方式
图:2014-2017年正保远程教育营业收入及同比增长
图:2009-2015财年ATA营业收入及同比增长
图:2009-2015财年ATA净利润及同比增长
图:2009-2015财年ATA毛利率(分财季)
图:2009-2015财年ATA净利率
图:2009-2015财年ATA营业收入(分财季)
表:2009-2014财年ATA营收构成(分业务)
图:2009-2015财年ATA设立的考试场次
图:2015-2018财年ATA营业收入及同比增长
图:2009-2013年中国教育集团营业收入及同比增长
图:2009-2013年中国教育集团净利润及同比增长
图:2009-2013年中国教育集团净利率
图:2009-2013年中国教育集团营收构成(分业务)
图:2009-2013年中国教育集团毛利率(分业务)
图:2009-2014年方直科技营业收入及同比增长
图:2009-2014年方直科技净利润及同比增长
图:2009-2014年方直科技净利率
图:2009-2014年方直科技营业收入(分产品)
图:2009-2014年方直科技营业收入(分区域)
图:2009-2014年方直科技毛利率(分产品)
表:2012-2014年方直科技毛利率(分区域)
表:2013-2014年方直科技来自前五大客户的销售收入及占比
表:培生集团的主要子公司
表:2012-2013年培生集团员工人数(分区域)
图:2009-2014年培生集团营业收入及同比增长
图:2009-2014年培生集团净利润及同比增长
图:2009-2014年培生集团净利率
图:2009-2013年培生集团营收构成(分业务)
图:2009-2013年培生集团营收构成(分区域及主要国家)
图:2008-2014年培生集团在华布局
图:2007-2012年培生集团在中国等新兴市场营业收入
图:2010-2013年华尔街英语学习中心数量及同比增长
图:2010-2013年华尔街英语全球注册学生人数及同比增长
图:2010-2013年华尔街英语(中国)注册学生人数及同比增长
图:2007-2013年环球教育学习中心数量及同比增长
图:2007-2013年环球教育学习中心数量构成
图:2007-2013年环球教育注册学生人数及同比增长
Number of Kindergartens and YoY Growth in China, 2003-2013
Admission and Enrollment of Kindergartens in China, 2003-2013
Number of Primary Schools in China, 2003-2013
Admission and Enrollment of Primary Schools in China, 2003-2013
Number of Junior Secondary Schools in China, 2003-2013
Admission, Enrollment and Graduates of Junior Secondary Schools in China, 2003-2013
Number of Senior Secondary Schools in China by Type, 2003-2013
Admission, Enrollment and Graduates of Regular Senior Secondary Schools in China, 2003-2013
Enrollment and Graduates of Adult Senior Secondary Schools in China, 2003-2013
Admission, Enrollment and Graduates of Regular Specialized Secondary Schools in China, 2003-2013
Admission, Enrollment and Graduates of Vocational Senior Secondary Schools in China, 2003-2013
Admission, Enrollment and Graduates of Skilled Workers Schools in China, 2003-2013
Admission, Enrollment and Graduates of Adult Specialized Secondary Schools in China, 2003-2013
Number of Higher Education Schools by Type in China, 2003-2013
Bachelor Admissions, Students Enrollment and Graduates in China, 2003-2013
Junior College Admissions, Students Enrollment and Graduates, 2003-2013
Master’s Degree Admissions, Students Enrollment and Graduates, 2003-2013
Doctorate Admissions, Students Enrollment and Graduates, 2003-2013
Adult Bachelor Program and Junior College Admissions, Students Enrollment and Graduates in China, 2004-2013
Number of Schools in China by Type, 2008-2013
Admission of Schools in China by Type, 2008-2013
Enrollment of Schools in China by Type, 2008-2013
Graduates of Schools in China by Type, 2008-2013
Number and YoY Growth of Education & Training Institutions in China, 2003-2013
Structure of Numbers of Education & Training Institutions in China by Type, 2004-2013
Number and YoY Growth of Rural Adult Culture & Technology Training Institutions in China, 2004-2013
Number and YoY Growth of Staff Technical Training Institutions in China, 2004-2013
Number and YoY Growth of Other Training Institutions (Including Social Training Agencies)
Distribution of Numbers of Education & Training Institutions by Region in China
Students Enrollment and YoY Growth of Education & Training Institutions in China, 2004-2013
Graduate Students and YoY Growth of Education & Training Institutions in China, 2004-2013
Faculties and YoY Growth of Education & Training Institutions in China, 2004-2013
China’s Total Investment in Education and YoY Growth, 2003-2013
Proportion of Public Financial Budget for Education to Public Financial Expenditure in China by Region, 2011-2012
China’s Urban Fixed Investment in Education Industry and YoY Growth, 2003-2013
Per Capita Education Spending of Urban Residents, 2003-2013
Main Target for the Development of Education of China, 2010-2020
Major Objective of Human Resource Development of China, 2010-2020
Eight Tasks for the Development of China’s Education, 2010-2020
Major Measures of China’s Reform of Educational System and Institution Innovation, 2010-2020
Ten Major Projects and Ten Pilot Reforms of China’s Education Development Planning, 2010-2020
Number of Secondary Vocational Education Schools and YoY Growth in China, 2003-2013
Number of Secondary Vocational Education Schools by Category in China, 2013Vs.2003
Number of Secondary Vocational Education Schools by Establishment in China,2012
Admission and YoY growth of Secondary Vocational Education Schools in China, 2003-2013
Admission of Secondary Vocational Education Schools by Category in China , 2013Vs.2003
Enrollment and YoY growth of Secondary Vocational Education Schools in China, 2003-2013
Enrollment of Secondary Vocational Education Schools by Category in China, 2013Vs.2003
Admission,Enrollment and Graduates of Secondary Vocational Education Schools by Major in China, 2012
Employment Rate of Graduates from Secondary Vocational Education Schools in China, 2005-2013
Employment Structure of Graduates from Secondary Vocational Education Schools in China, 2008-2013
Employment Structure of Graduates from Secondary Vocational Education Schools in China by Industry, 2008-2013
Employment Channels of Graduates from Secondary Vocational Education Schools in China, 2008-2013
Public Finance Budget Education Operating Expenses of Secondary Vocational Education per Student in China by Region, 2006-2012
Number of Higher Vocational Education Schools in China, 2004-2013
Admission and YoY growth of Higher Vocational Colleges in China, 2003-2013
Enrollment and YoY Growth of Higher Vocational Colleges in China, 2003-2013
Admission, Enrollment and Graduates of Higher Vocational Colleges in China by Major, 2012
Employment Rate for Higher Vocational College Graduates in China, 2007-2013
Quantitative Objectives of Modern Vocational Education System Construction in China, 2012-2020
Key Development Areas (by Sector) of Vocational Education in China
Government Policies on Non-Government Funded Education, 1982-2014
Number of Non-Government Education Schools and Training Institutions in China, 2008-2013
% of Private Schools in the Total Number of Schools by Type, 2008-2013
Admission of Private Education Schools by Type in China, 2008-2013
Enrollment of Private Education Schools by Type in China,2008-2013
Graduates of Private Education Schools by Type in China, 2008-2013
Staff of Private Education Schools by Type in China, 2008-2013
Number of Private Kindergartens and YoY Growth in China, 2003-2013
% of Private Kindergartens in the Total Number of Kindergartens
Number of Private Kindergartens by Region in China, 2003-2013
Admission of Private Kindergartens in China, 2008-2017
% of Admission of Private Kindergartens in Total Kindergartens in China, 2008-2017
China's Enrollment of Private Kindergartens in Total Kindergartens, 2008-2017
Top 20 Private Universities in China, 2013-2014
Region Structure of Top 100 Private Universities in China, 2013-2014
Top 20 Independent Institutions in China, 2013-2014
Region Structure of Top 100 Independent Institutions in China, 2013-2014
Number of Private Training Institutions and YoY Growth in China, 2004-2013
Number of Private Training Institutions by Type, 2004-2013
Enrollment of Private Training Institutions and YoY Growth, 2004-2013
Enrollment of Private Training Institutions by Type, 2004-2013
Classification of Education and Training Industry
Development Stages of Policy Support, Market Demand, Market Maturity, Barriers to Entry, Capital Concern of Education and Training Industry Segments
Market Size and YoY Growth of Education and Training Industry in China, 2008-2017
Major Models, Core Elements, and Representative Companies of Pre-school Education in China
Enrollment of Primary and Secondary School Students in China, 2008-2013
Market Size and YoY Growth of K-12 Education in China
Top10 Companies in China’s After-school Tutoring for Primary and Secondary School Students and Their Market Shares by Revenue, 2013
Number of Chinese Students Studying Overseas and YoY Growth, 2008-2013
Market Size and YoY Growth of Language Training in China, 2008-2017
Top10 English Training Institution and Their Teaching Model & Training Participants
Market Segments of Vocational Training
Market Size and YoY Growth of Vocational Training in China, 2008-2017
Market Size and YoY Growth of IT Training in China, 2008-2017
Online Education Users and YoY Growth in China, 2008-2017E
Online Education Market Size and YoY Growth in China, 2008-2017E
Penetration of Online Education/Training in China, 2008-2017E
Revenue from Online Education Business of Major Companies in China, 2013
Revenue and YoY Growth of New Oriental Education & Technology, FY2009-FY2014
Net Income and YoY Growth of New Oriental Education & Technology, FY2009-FY2014
Net Profit Margin of New Oriental Education & Technology, FY2009-FY2014
Revenue of New Oriental Education & Technology by Quarter, FY2009-FY2014
Number of New Oriental Education & Technology’s Schools and Learning Centers by Quarter, 2009-2014
Number of New Oriental Education & Technology’s Schools and Learning Centers by City, as of FY2014
Student Enrollments for Language and Exam Training Courses of New Oriental Education & Technology by Quarter, 2009-2014
Student Enrollments of New Oriental Education & Technology by Business, FY2014
Revenue and YoY Growth of New Oriental Education & Technology's Online Education Business, FY2011-FY2017
Selling and Marketing Costs of New Oriental Education & Technology, FY2009-FY2014
Marketing Model of New Oriental Education & Technology
Service Model of Xueda Education
Employee Structure of Xueda Education, 2011-2014
Revenue and YoY Growth of Xueda Education, 2009-2014
Net Income and YoY Growth of Xueda Education, 2009-2014
Net Profit Margin of Xueda Education, 2009-2014
Number of Learning Centers YoY Growth of Xueda Education, 2007-2014
Expansion Routes of Xueda's Learning Centers, 2009-2013
Number of Xueda's Learning Centers by City, As of June,2014
Number of Students Served by Xueda Education and YoY Growth, 2007-2014
Average Hourly Course Fee and YoY Growth of Xueda Education
Cloud-based Tutoring Platform of Xueda Education
Development Roadmap of Xueda Education, 2014-2015
Revenue and YoY Growth of TAL EDUCATION GROUP, FY2009-FY2015
Net Income and YoY Growth of TAL Education Group, FY2009-FY2015
Net Profit Margin of TAL Education Group, FY2009-FY2015
Number of Learning Centers and YoY Growth of TAL,FY2008-FY2015
Number of TAL's Learning Centers by City, as of FY2015Q1
Enrollment, YoY Growth and Average Selling Prices of TAL Education Group, FY2009-FY2015
Core Courses and Main Business of TAL
Service Mode of TAL
Revenue and YoY Growth of Xueersi.com, FY2011-FY2018
Layout of TAL's Online Education Business, 2003-2014
Online Education Products of TAL by Students' age
Business Structure of Ambow Education
Revenue and YoY Growth of Ambow Education, 2009-2013
Net Income and YoY Growth of Ambow Education, 2009-2013
Net profit Margin of Ambow Education, 2009-2013
Revenue Structure of Ambow Education by Business, 2009-2013
Revenue Structure of Ambow Education by Segment, 2009-2013
Number of Ambow's Learning Centers by City, as of 2013
Student Enrollments of Ambow Education by Segment, 2010-2013
Corporate Structure of Tarena
Revenue and YoY Growth of Tarena, 2011-2017
Net Income and YoY Growth of Tarena, 2011-2017
Net Profit Margin of Tarena, 2011-2017
Gross Profit and Gross Profit Margin of Tarena, 2011-2014
Cost Structure of Tarena, 2011-2014
Learning Centers and Courses of Tarena by City, as of June,2014
Expansion Routes of Tarena's Learning Centers
Expansion Routes of Tarena's Courses
Student Enrollments of Tarena by Channel, 2011-2014
Student Enrollments of Tarena by Quarter, 2011-2014
Student Enrollments of Tarena by Course, 2011-2014
Average Revenue per student of Tarena, 2011-2014
Revenue and YoY Growth of ChinaEdu, 2009-2013
Net Income and YoY Growth of ChinaEdu, 2009-2013
Net Profit Margin of ChinaEdu, 2009-2013
Revenue of ChinaEdu by Quarter, 2009-2013
Revenue Structure of ChinaEdu by Business and Quarter, 2009-2013
Gross Margin of ChinaEdu by Business, 2009-2013
Number of ChinaEdu’s Learning Centers, 2007-2013
Number of ChinaEdu’s Online Degree Program Students by Quarterly, 2008-2012
Business Structure of ChinaEdu
Revenue and YoY Growth of ChinaEdu, 2014-2017
Revenue and YoY Growth of China Distance Education, FY2009-FY2014
Net Income and YoY Growth of China Distance Education, FY2009-FY2014
Net Profit Margin of China Distance Education, FY2009-FY2014
Revenue Structure of China Distance Education (by Financial Quarter), FY2009-FY2014
Revenue Structure of China Distance Education (by Business and Financial Quarter), FY2009-FY2014
Revenue Structure of China Distance Education's Online Education Business (by Course), FY2013
Student Enrollments and Per Capita Consumption of China Distance Education's Courses, FY2009-FY2014
Enrollment Breakdown of China Distance Education's Courses (by Quarter), FY2009-FY2014
Business Structure of China Distance Education
Course Forms of China Distance Education
Mode of Payment for China Distance Education's Courses
Revenue and YoY Growth of China Distance Education, FY2014-FY2017
Revenue and YoY Growth of ATA, FY2009-FY2015
Net Income and YoY Growth of ATA, FY2009-FY2015
Gross Margin of ATA by Financial Quarter, FY2009-FY2015
Net Profit Margin of ATA, FY2009-FY2015
Revenue of ATA by Financial Quarter, FY2009-FY2015
Revenue Structure of ATA by Business, FY2009-FY2014
Number of Tests of ATA by Financial Quarter, 2009-2015
Revenue and YoY Growth of ATA, FY2015-FY2018
Revenue and YoY Growth of China Education Alliance, 2009-2013
Net Income and YoY Growth of China Education Alliance, 2009-2013
Net Profit Margin of China Education Alliance, 2009-2013
Revenue Structure of China Education Alliance, 2009-2013
Gross Margin of China Education Alliance by Business, 2009-2013
Revenue and YoY Growth of Shenzhen Kingsun Science & Technology, 2009-2014
Net Income and YoY Growth of Shenzhen Kingsun Science & Technology, 2009-2014
Net Profit Margin of Shenzhen Kingsun Science & Technology, 2009-2014
Revenue Structure of Shenzhen Kingsun Science & Technology by Product, 2009-2014
Revenue Structure of Shenzhen Kingsun Science & Technology by Region, 2009-2014
Gross Margin of Shenzhen Kingsun Science & Technology by Product, 2009-2014
Gross Margin of Shenzhen Kingsun Science & Technology by Region, 2009-2014
Revenue of Shenzhen Kingsun Science & Technology from Top 5 Clients and % of Total Revenue, 2013-2014
Major Subsidiaries of Pearson Group
Number of Employees of Pearson Group by Region, 2011-2013
Revenue and YoY Growth of Pearson Group, 2009-2014
Net Income and YoY Growth of Pearson Group, 2009-2014
Net Profit Margin of Pearson Group, 2009-2014
Revenue Structure of Pearson Group by Business, 2009-2014
Revenue Structure of Pearson Group by Region and Major Country, 2009-2014
Pearson's Layout in China
Pearson’s Revenue from China and Other Emerging Markets, 2007-2012
Number of Learning Centers and YoY Growth of Wall Street English, 2010-2013
Global Student Enrolments and YoY Growth of Wall Street English, 2010-2013
Student Enrolments and YoY Growth of Wall Street English(China), 2010-2013
Number of Learning centers and YoY Growth of Global Education, 2007-2013
Structure of Learning Centers of Global Education, 2007-2013
Student Enrolments and YoY Growth of Global Education, 2007-2013
如果这份报告不能满足您的要求,我们还可以为您定制报告,请 留言说明您的详细需求。
|