|
|
|
报告导航:研究报告—
制造业—材料
|
|
2014-2017年全球及中国低辐射玻璃行业研究报告 |
 |
字数:2.8万 |
页数:94 |
图表数:123 |
|
中文电子版:7000元 |
中文纸版:3500元 |
中文(电子+纸)版:7500元 |
|
英文电子版:2300美元 |
英文纸版:2400美元 |
英文(电子+纸)版:2600美元 |
|
编号:ZHP015
|
发布日期:2014-12 |
附件:下载 |
 |
|
|
低辐射(Low-E)玻璃是一种热辐射率低、阻热性能高、光控和热控能力良好的节能玻璃,主要应用在建筑、电子、汽车等领域。
受技术改进、节能减排等利好因素的影响,中国低辐射玻璃的产量由2005年的600万㎡增长至2013年的13,400万㎡,年均复合增长率约47%。预计2014年产量将进一步增长至15,200万平方米。
尽管中国低辐射玻璃已经实现规模化生产,但是其普及率仅在11%左右,与德国、韩国、美国等发达国家(低辐射玻璃普及率大多已超过80%)相比还存在一定的差距,未来增长空间较大。预计2014-2017年,中国低辐射玻璃需求量的年均复合增长率在23.5%左右。
2009年之前,中国大陆Low-E玻璃行业集中度相对较高,南玻、台玻、耀皮等6大企业合占总产能的70%左右;但随着涉足企业的增加,行业集中度开始下降,2014年中国大陆Low-E玻璃行业前6企业产能占比仅达47.4%。目前中国各大Low-E玻璃企业仍在积极进行产能扩张以提高市场竞争力。
台玻集团:2013年9月,投资2.4亿美元在沈阳建设Low-E玻璃厂。该项目分两期完成,一期主要建设一条复层Low-E玻璃生产线和两条真空Low-E玻璃生产线,预计2015年底建成投产。
南玻集团: Low-E玻璃生产基地有5个,即天津、东莞、吴江、咸宁、成都。2014年,咸宁、吴江生产基地各新增Low-E玻璃产能300万平方米/年、120万平方米/年。至此,公司Low-E玻璃产能达到3060万平方米/年。
水清木华研究中心《2014-2017年全球及中国低辐射行业研究报告》着重研究了以下内容:
 全球低辐射玻璃行业现状、市场规模等情况; 全球低辐射玻璃行业现状、市场规模等情况;
中国低辐射玻璃行业政治环境、社会环境、技术环境等情况;
中国低辐射玻璃供给、需求、竞争格局等情况;
国外4家低辐射玻璃生产商经营情况、营收结构、在华布局等情况;
中国13家低辐射玻璃生产商经营情况、营收结构、竞争优势等情况.
Low-emissivity glass (low-E glass) is a type of energy-saving glass with low rate of thermal radiation, high heat-resistance performance, good light- and thermal-control abilities, mainly used in building, electronics, automobile and other fields.
Influenced by positive factors such as technological improvement, energy conservation and emission reduction, China’s low-e glass production rose from 6 million square meters in 2005 to 134 million square meters in 2013 at a CAGR of roughly 47%, and is expected to further increase to 152 million square meters in 2014.
Although low-e glass can realize large-scale production in China, yet its penetration rate is only around 11%, still lagging behind Germany, South Korea, the United States and other developed countries (mostly over 80%), leaving large room for growth. It is expected that China’s demand for low-e glass will increase at a CAGR of 23.5% or so during the period 2014-2017.
The Chinese mainland low-e glass industry was highly concentrated prior to 2009: six big enterprises including CSG Holding Co., Ltd., Taiwan Glass Group and Shanghai Yaohua Pilkington Glass Group Co., Ltd. (SYP Group) accounted for a combined 70 percent of total capacity. However, with the increasing number of enterprises involved, the industry concentration began to decline: the proportion occupied by the top 6 enterprises there was merely 47.4% in 2014. Currently, key industry players in China are actively continuing with their capacity expansion to enhance competitiveness.
Taiwan Glass Group invested USD240 million in the construction of a low-e glass factory in Shenyang in September 2013. The project is to be finished in two phases, of which, the first phase concerns a low-e laminated glass production line and two low-e vacuum glass production lines expected to be completed and put into production by the end of 2015.
CSG Holding has 5 low-e glass production bases respectively in Tianjin, Dongguan, Wujiang, Xianning and Chengdu. In 2014, production bases in Xianning and Wujiang each saw additional capacities of 3 million square meters per year and 1.2 million square meters per year. The company’s low-e glass capacity thus far has been 30.6 million square meters per year.

Global and China Low-E Glass Industry Report, 2014-2017 focuses on the following:
Status quo, market size, and others of global low-e glass industry;
Policy environment, social environment, technological environment, and others of China’s low-e glass industry;
Low-e glass supply, demand, competition, etc. in China;
Operation, revenue structure, layout-in-China, and others of 4 foreign low-e glass manufacturers;
Operation, revenue structure, competitive advantage, and others of 13 Chinese low-e glass manufacturers.
第一章 低辐射玻璃行业概述
1.1 定义与分类
1.2 节能效果
第二章 全球低辐射玻璃行业现状
2.1 发展历程
2.2 主要国家建筑节能政策
2.2.1 德国
2.2.2 美国
2.2.3 日本
2.3 市场现状
第三章 中国低辐射玻璃行业运行环境
3.1 政策环境
3.2 社会环境
3.3 技术环境
第四章 中国低辐射玻璃生产状况
4.1 生产成本
4.2 供给
4.2.1 产能
4.2.2 产量
4.3 竞争格局
第五章 中国低辐射玻璃需求状况
5.1 推广Low-E玻璃的重要性
5.2 应用现状
5.3 价格
5.4 需求量
第六章 国外重点企业分析
6.1 PPG工业公司
6.1.1 企业简介
6.1.2 经营情况
6.1.3 营收构成
6.1.4 Low-E玻璃业务
6.1.5 在华业务
6.2 日本板硝子株式会社(NSG)
6.2.1 企业简介
6.2.2 经营情况
6.2.3 营收构成
6.2.4 Low-E玻璃业务
6.2.5 在华业务
6.3 旭硝子株式会社(AGC)
6.3.1 企业简介
6.3.2 经营情况
6.3.3 营收构成
6.3.4 Low-E玻璃业务
6.3.5 在华业务
6.4 圣戈班集团(Saint-Gobain)
6.4.1 企业简介
6.4.2 经营情况
6.4.3 营收构成
6.4.4 Low-E玻璃业务
6.4.5 在华业务
第七章 中国重点企业分析
7.1中国南玻集团股份有限公司
7.1.1 企业简介
7.1.2 经营情况
7.1.3 营收构成
7.1.4 毛利率
7.1.5 研发与投资
7.1.6 Low-E玻璃业务
7.2 台玻集团
7.2.1 企业简介
7.2.2 经营情况
7.2.3 Low-E玻璃业务
7.2.4 台玻长江玻璃有限公司
7.2.5 台玻成都玻璃有限公司
7.2.6 台玻安徽玻璃有限公司
7.2.7 台玻咸阳玻璃有限公司
7.3 信义玻璃控股有限公司
7.3.1 企业简介
7.3.2 经营情况
7.3.3 营收构成
7.3.4 毛利率
7.3.5 Low-E玻璃业务
7.3.6 发展动态
7.4 上海耀皮玻璃集团股份有限公司
7.4.1 企业简介
7.4.2 经营情况
7.4.3 营收构成
7.4.4 毛利率
7.4.5 研发与投资
7.4.6 Low-E玻璃业务
7.5 中国玻璃控股有限公司
7.5.1 企业简介
7.5.2 经营情况
7.5.3 营收构成
7.5.4 毛利率
7.5.5 Low-E玻璃业务
7.6 中航三鑫股份有限公司
7.6.1 企业简介
7.6.2 经营情况
7.6.3 营收构成
7.6.4 毛利率
7.6.5 Low-E玻璃业务
7.7 株洲旗滨集团股份有限公司
7.7.1 企业简介
7.7.2 经营情况
7.7.3 营收构成
7.7.4 毛利率
7.7.5 Low-E玻璃业务
7.7.6 主要项目
7.8 山东金晶科技股份有限公司
7.8.1 企业简介
7.8.2 经营情况
7.8.3 营收构成
7.8.4 毛利率
7.8.5 Low-E玻璃业务
7.8.6 发展动态
7.9 其他企业
7.9.1 格兰特工程玻璃(中山)有限公司
7.9.2 苏州华东镀膜玻璃有限公司
7.9.3 威海蓝星玻璃股份有限公司
7.9.4 中国耀华玻璃集团公司
7.9.5 明达玻璃(厦门)有限公司
第八章 总结与预测
8.1 市场
8.2 企业
1. Overview of Low-E Glass Industry
1.1 Definition and Classification
1.2 Energy-saving Effect
2. Status of Global Low-E Glass Industry
2.1 Development History
2.2 Building Energy-conserving Policies of Main Countries
2.2.1 Germany
2.2.2 USA
2.2.3 Japan
2.3 Market Status
3. Operating Environment for China Low-E Glass Industry
3.1 Policy Environment
3.2 Social Environment
3.3 Technological Environment
4. Low-E Glass Production in China
4.1 Production Cost
4.2 Supply
4.2.1 Capacity
4.2.2 Output
4.3 Competition
5. Low-E Glass Demand in China
5.1 Importance of Promoting Low-E Glass
5.2 Application
5.3 Price
5.4 Demand
6. Key Players Abroad
6.1 PPG Industries
6.1.1 Profile
6.1.2 Operation
6.1.3 Revenue Structure
6.1.4 Low-E Glass Business
6.1.5 Business in China
6.2 Nippon Sheet Glass (NSG)
6.2.1 Profile
6.2.2 Operation
6.2.3 Revenue Structure
6.2.4 Low-E Glass Business
6.2.5 Business in China
6.3 Asahi Glass Co. (AGC)
6.3.1 Profile
6.3.2 Operation
6.3.3 Revenue Structure
6.3.4 Low-E Glass Business
6.3.5 Business in China
6.4 Saint-Gobain
6.4.1 Profile
6.4.2 Operation
6.4.3 Revenue Structure
6.4.4 Low-E Glass Business
6.4.5 Business in China
7. Key Players in China
7.1 CSG Holding
7.1.1 Profile
7.1.2 Operation
7.1.3 Revenue Structure
7.1.4 Gross Margin
7.1.5 R&D and Investment
7.1.6 Low-E Glass Business
7.2 Taiwan Glass Group
7.2.1 Profile
7.2.2 Operation
7.2.3 Low-E Glass Business
7.2.4 TG Changjiang Glass Co., Ltd.
7.2.5 TG Chengdu Glass Co., Ltd.
7.2.6 TG Anhui Glass Co., Ltd.
7.2.7 TG Chengdu Glass Co., Ltd.
7.3 Xinyi Glass
7.3.1 Profile
7.3.2 Operation
7.3.3 Revenue Structure
7.3.4 Gross Margin
7.3.5 Low-E Glass Business
7.3.6 Developments
7.4 Shanghai Yaohua Pilkington Glass Group Co., Ltd. (SYP Group)
7.4.1 Profile
7.4.2 Operation
7.4.3 Revenue Structure
7.4.4 Gross Margin
7.4.5 R&D and Investment
7.4.6 Low-E Glass Business
7.5 China Glass
7.5.1 Profile
7.5.2 Operation
7.5.3 Revenue Structure
7.5.4 Gross Margin
7.5.5 Low-E Glass Business
7.6 AVIC Sanxin
7.6.1 Profile
7.6.2 Operation
7.6.3 Revenue Structure
7.6.4 Gross Margin
7.6.5 Low-E Glass Business
7.7 Zhuzhou Kibing Group
7.7.1 Profile
7.7.2 Operation
7.7.3 Revenue Structure
7.7.4 Gross Margin
7.7.5 Low-E Glass Business
7.7.6 Key Projects
7.8 Shandong Jinjing Science & Technology Stock Co., Ltd.
7.8.1 Profile
7.8.2 Operation
7.8.3 Revenue Structure
7.8.4 Gross Margin
7.8.5 Low-E Glass Business
7.8.6 Developments
7.9 Others
7.9.1 Grand Engineering Glass (ZhongShan) Co., Ltd.
7.9.2 Suzhou Huadong Coating Glass Co., Ltd.
7.9.3 Weihai Blue Star Glass Holding Co., Ltd
7.9.4 China Yaohua Glass Group Corporation
7.9.5 Intex Glass (Xiamen) Co., Ltd.
8. Summary and Forecast
8.1 Market
8.2 Enterprise
图:节能玻璃分类
图:Low-E玻璃关系划分
表:离线法与在线法Low-E玻璃的区别
表:低辐射玻璃主要品种及适用性
图:主要玻璃光热参数
表:各种玻璃节能效果对比
图:全球Low-E玻璃发展历程
表:德国建筑节能相关政策
表:德国窗户传热系数限值标准
表:1975-2013年美国建筑节能相关政策
图:1975-2015年美国居住建筑及商业建筑能源效率改善趋势
表:1979-2013年日本建筑节能相关政策
图:1990-2017年全球Low-E玻璃销量及复合增速
图:欧洲主要国家Low-E玻璃在建筑领域普及度
图:2013年全球主要国家Low-E玻璃普及率
表:国外Low-E玻璃工艺及主要生产企业
表:2011-2014年中国建筑节能相关政策及法规
图:2010-2015年中国新增节能建筑面积
表:各种不同玻璃、不同结构玻璃的节能效果
图:Low-E玻璃制造成本结构(以进口设备为例)
图:Low-E玻璃单位加工成本
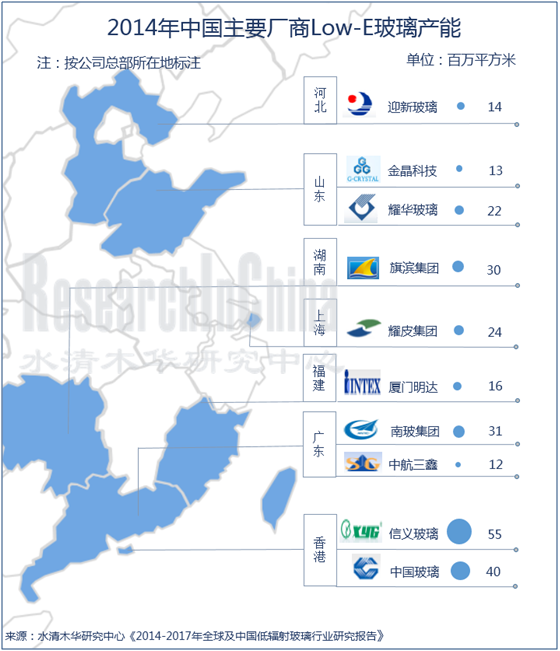
表:2014年中国主要企业Low-E玻璃产能
图:2005-2017年中国Low-e玻璃产能
表:中国采用国产设备的Low-E玻璃生产线
图:2014年中国Low-E玻璃(分省市)产能构成
图:2005-2017年中国Low-E玻璃产量及增速
图:2014年中国Low-E玻璃(分企业)设计产能结构
图:2008-2013年中国Low-E玻璃主要企业营业收入
图:中国社会总能耗中各种能耗占比
图:中国北方住宅建筑能耗中各种能耗占比
图:2012-2013年中国5mm单银Low-E玻璃均价走势
图:2006-2017年中国建筑玻璃及Low-E玻璃需求量
表:截止2013年底PPG工厂(分地区)分布
图:2008-2014年PPG营业收入与净利润
图:2009-2013年PPG(分业务)营业收入构成
图:2011-2013年PPG(分地区)营业收入
图:PPG公司Low-E玻璃业务结构
图:2007-2013年PPG工业玻璃业务营业收入与净利润
表:PPG在中国的Low-E玻璃业务合作情况
图:FY2009-FY2015年NSG营业收入与净利润
图:FY2009-FY2015年NSG(分业务)营业收入构成
图:FY2013-FY2014年NSG(分地区)营业收入构成
图:FY2014年NSG主要产品(分地区)营业收入构成
图:FY2009-FY2015年NSG建筑玻璃业务收入与营业利润
图:FY2012-FY2014年NSG建筑玻璃业务(分地区)营业收入构成
表:2013年NSG在中国主要子公司分布
图:AGC(分地区)玻璃生产线
图:2008-2014年AGC营业收入与净利润
图:2010-2014年AGC集团(分产品)营业收入构成
图:2011-2013年AGC集团(分地区)营业收入构成
图:AGC集团玻璃业务主要产品及服务
图:2009-2014年AGC玻璃业务营业收入与同比增长
表:2013年AGC玻璃业务(分地区)营业收入构成
图:截止2013年底AGC在中国(分产品)主要子公司
图:AGC中国区营销网络
图:2009-2014年圣戈班营业收入与净利润
图:2009-2014年圣戈班(分业务)营业收入构成
图:2009-2014年圣戈班(分地区)营业收入构成
图:2013年圣戈班平板玻璃业务产品
图:2009-2014年圣戈班平板玻璃业务营业收入与营业利润
图:2013年圣戈班平板玻璃业务(分地区)营业收入占比
图:2013年圣戈班玻璃业务(分用途)营业收入构成
图:2002-2013年圣戈班在中国的销售额及增速
表:2013年圣戈班玻璃业务在中国的主要企业
图:南玻集团全球营销网络
图:2007-2014年南玻集团营业收入与净利润
图:2008-2014年南玻集团(分产品)营业收入构成
图:2008-2014年南玻集团(分地区)营业收入构成
图:2008-2014年南玻集团(分产品)毛利率
表:截止2014年6月南玻集团工程玻璃相关在建项目
图:2008-2014年南玻集团工程玻璃业务收入
表:2011-2014年南玻集团工程玻璃业务主要子公司营业收入
表:2004-2013年南玻集团(分产品/分地区) Low-E玻璃产能
图:2008-2014年台玻集团营业收入与净利润
图:台玻集团主要生产基地分布
表:2014年台玻集团(分工厂)Low-E玻璃生产线及产能
表:2013年长江玻璃产品生产线情况
表:台玻安徽玻璃生产线项目
图:2007-2014年信义集团营业收入与净利润
图:2007-2014年信义玻璃(分产品)营业收入构成
图:2007-2014年信义玻璃(分地区)营业收入构成
图:2008-2014年信义玻璃(分产品)毛利率
图:信义玻璃中国区工程玻璃营销网络
表:2014年信义玻璃主要Low-E玻璃生产线及产能
图:耀皮玻璃中国营销网络
图:2007-2014年耀皮玻璃营业收入与净利润
图:2008-2014年耀皮玻璃(分产品)营业收入构成
图:2006-2014年耀皮玻璃(分地区)营业收入
图:2006-2014年耀皮玻璃(分产品)毛利率
表:2014年耀皮玻璃拟建设项目
表:2009-2014年耀皮玻璃Low-E玻璃(分地区)生产线及产能
图:2007-2014年中国玻璃营业收入与净利润
图:2010-2014年中国玻璃(分产品)营业收入构成
图:2008-2013年中国玻璃(分地区)营业收入
图:2010-2014年中国玻璃(分产品)毛利率
图:2010-2014年中国镀膜玻璃业务收入
表:2014年中国玻璃Low-E玻璃生产线及产能
图:2007-2014年中航三鑫营业收入与净利润
表:2014上半年中航三鑫子公司营业收入与净利润
图:2008-2014年中航三鑫(分产品)营业收入构成
图:2008-2014年中航三鑫(分地区)营业收入
图:2008-2014年中航三鑫(分产品)毛利率
图:2008-2014年中航三鑫特种玻璃业务收入及增速
表:2013年中航三鑫Low-E玻璃生产线
图:旗滨集团全球营销网络
图:2008-2014年旗滨集团营业收入与净利润
图:2008-2014年旗滨集团(分产品)营业收入构成
图:2008-2014年旗滨集团(分地区)营业收入
图:2008-2014年旗滨集团(分产品)毛利率
表:2014年旗滨集团Low-E玻璃产品产能
表:2013-2014年旗滨集团主要建设项目
图:2006-2014年金晶科技营业收入与净利润
表:2008-2014年金晶科技(分产品)营业收入及占比
图:2008-2014年金晶科技(分地区)营业收入
图:2008-2014年金晶科技(分产品)毛利率
表:2013年金晶科技Low-E玻璃产品产能
图:2007-2014年蓝星玻璃营业收入与净利润
表:耀华玻璃主要产品及子公司
图:明达玻璃全球营销网络
图:2006-2017年中国Low-E玻璃产能增速
图:2006-2017年中国Low-E玻璃产量及需求量增速
图:2008-2014年全球主要Low-E玻璃生产商营业收入增速
图:2014年中国生产商Low-E玻璃产能排名(Top 10)
Classification of Energy-efficient Glass
Relation Division in Low-E Glass
Difference between Offline and Online Low-E Glass
Applicability of Low-E Glass by Main Varieties
Optothermal Parameters of Major Classes
Comparison of Energy-saving Effect of Glasses
Development History of Global Low-E Glass
Building Energy-conserving Policies in Germany
German Standards for Limiting Window Heat Transfer Coefficient
Building Energy-conserving Policies in the U.S., 1975-2013
U.S. Residential Building and Commercial Building Energy Efficiency Improvement Trends, 1975-2015
Building Energy-conserving Policies in Japan, 1979-2013
Global Low-E Glass Sales Volume and Compound Growth Rate, 1990-2017E
Building Low-E Glass Market Share, Sales Volume and Compound Growth Rate in Major European Countries, 1991-2007
Popularity of Low-E Architectural Glass in Major European Countries
Popularity of Low-E Glass in Major Countries Worldwide, 2013
Low-E Glass Technologies and Main Manufacturers Abroad
Building Energy-conserving Policies and Regulations in China, 2011-2014
New Energy-saving Building Area in China, 2010-2015
Energy-saving Effects of Different Glasses / Glass structures
Cost Structure of Low-E Glass Manufacturing (e.g. Imported Equipment)
Unit Cost of Low-E Glass Processing
Low-E Glass Capacities of Major Enterprises in China, 2014
Capacity of Low-E Glass in China, 2005-2017E
Low-E Glass Production Lines Adopting Homemade Equipment in China
Capacity Structure of Low-E Glass in China (by Province/City), 2014
Output and Growth Rate of Low-E Glass in China, 2005-2017E
Design Capacity Structure of Low-E Glass in China (by Enterprise), 2014
Revenue of Major Low-E Glass Enterprises in China, 2008-2013
Total Energy Consumption Structure in China
Residential Building Energy Consumption Structure in Northern China
5mm Single Silver Low-E Glass Price Trends in China, 2012-2013
Demand for Building Glass and Low-E Glass in China, 2006-2017E
Distribution of PPG Factories (by Region) as of End-2013
Revenue and Net Income of PPG, 2008-2014
Revenue Structure of PPG (by Business), 2009-2013
Revenue Breakdown of PPG (by Region), 2011-2013
Low-E Glass Business Structure of PPG
Revenue and Net Income of PPG’s Industrial Glass Business, 2007-2013
Low-E Glass-related Cooperation of PPG in China
Revenue and Net Income of NSG, FY2009-FY2015E
Revenue Structure of NSG (by Business), FY2009-FY2015E
Revenue Structure of NSG (by Region), FY2013-FY2014
Revenue Structure of NSG’s Main Products (by Region), FY2014
Revenue and Operating Income of NSG’s Architectural Glass Business, FY2009-FY2015E
Revenue Structure of NSG’s Architectural Glass Business (by Region), 2012-FY2014
Distribution of NSG’s Major Subsidiaries in China, 2013
Glass Production Lines of AGC (by Region)
Revenue and Net Income of AGC, 2008-2014
Revenue Structure of AGC (by Product), 2010-2014
Revenue Structure of AGC (by Region), 2011-2013
Main Products and Services of AGC’s Glass Business
Revenue and YoY Growth of AGC’s Glass Business, 2009-2014
Revenue Structure of AGC’s Glass Business (by Region), 2013
Major Subsidiaries of AGC in China (by Product) as of End-2013
Marketing Network of AGC in China
Revenue and Net Income of Saint-Gobain, 2009-2014
Revenue Structure of Saint-Gobain (by Business), 2009-2014
Revenue Structure of Saint-Gobain (by Region), 2009-2014
Flat Glass Products of Saint-Gobain, 2013
Revenue and Operating Income of Saint-Gobain’s Flat Glass Business, 2009-2014
Revenue Structure of Saint-Gobain’s Flat Glass Business, (by Region), 2013
Revenue Structure of Saint-Gobain’s Glass Business, (by Purpose), 2013
Sales and Growth Rate of Saint-Gobain’s Sales in China, 2002-2013
Major Glass Enterprises of Saint-Gobain in China, 2013
Global Marketing Network of CSG
Revenue and Net Income of CSG, 2007-2014
Revenue Structure of CSG (by Product), 2008-2014
Revenue Structure of CSG (by Region), 2008-2014
Gross Margin of CSG (by Product), 2008-2014
Architectural Glass-related Projects in Progress of CSG as of June 2014
Revenue of CSG’s Architectural Glass Business, 2008-2014
Revenue of CSG’s Major Architectural Glass Subsidiaries, 2011-2014
Low-E Glass Capacity of CSG (by Product/Region), 2004-2013
Revenue and Net Income of Taiwan Glass Group, 2008-2014
Distribution of Major Production Bases of Taiwan Glass Group
Capacities of Low-E Glass Production Lines of Taiwan Glass Group (by Factory), 2014
Production Lines of TG Changjiang Glass, 2013
Production Lines of TG Anhui Glass
Revenue and Net Income of Xinyi Group, 2007-2014
Revenue Structure of Xinyi Glass (by Product), 2007-2014
Revenue Structure of Xinyi Glass (by Region), 2007-2014
Gross Margin of Xinyi Glass (by Product), 2008-2014
Architectural Glass Sales Network of Xinyi Glass in China
Capacities of Major Low-E Glass Production Lines of Xinyi Glass, 2014
Marketing Network of SYP Group in China
Revenue and Net Income of SYP Group, 2007-2014
Revenue Structure of SYP Group (by Product), 2008-2014
Revenue Breakdown of SYP Group (by Region), 2006-2014
Gross Margin of SYP Group (by Product), 2006-2014
Proposed Projects of SYP Group, 2014
Capacities of Low-E Glass Production Lines of SYP Group (by Region), 2009-2014
Revenue and Net Income of China Glass, 2007-2014
Revenue Structure of China Glass (by Product), 2010-2014
Revenue Breakdown of China Glass (by Region), 2008-2013
Gross Margin of China Class (by Product), 2010-2014
Revenue of China Coated Glass, 2010-2014
Capacities of Low-E Glass Production Lines of China Glass, 2014
Revenue and Net Income of AVIC Sanxin, 2007-2014
Revenue and Net Income of AVIC Sanxin’s Subsidiaries, 2014H1
Revenue Structure of AVIC Sanxin (by Product), 2008-2014
Revenue Breakdown of AVIC Sanxin (by Region), 2008-2014
Gross Margin of AVIC Sanxin (by Product), 2008-2014
Revenue and Growth Rate of AVIC Sanxin’s Special Glass Business, 2008-2014
Low-E Glass Production Lines of AVIC Sanxin, 2013
Global Marketing Network of Kibing Group
Revenue and Net Income of Kibing Group, 2008-2014
Revenue Structure of Kibing Group (by Product), 2008-2014
Revenue Breakdown of Kibing Group (by Region), 2008-2014
Gross Margin of Kibing Group (by Product), 2008-2014
Capacities of Low-E Glass Products of Kibing Group, 2014
Main Construction Projects of Kibing Group, 2013-2014
Revenue and Net Income of Shandong Jinjing Science & Technology, 2006-2014
Revenue Breakdown and Percentage of Shandong Jinjing Science & Technology (by Product), 2008-2014
Revenue Breakdown of Shandong Jinjing Science & Technology (by Region), 2008-2014
Gross Margin of Shandong Jinjing Science & Technology (by Product), 2008-2014
Capacities of Low-E Glass Products of Shandong Jinjing Science & Technology, 2013
Revenue and Net Income of Blue Star Glass, 2007-2014
Main Products and Subsidiaries of China Yaohua Glass Group Corporation
Global Marketing Network of Intex Glass
Capacity Growth of Low-E Glass in China, 2006-2017E
Output and Demand Growth of Low-E Glass in China, 2006-2017E
Revenue Growth of Major Worldwide Low-E Glass Manufacturers, 2008-2014
Top 10 Low-E Glass Manufacturers in China (by Capacity), 2014
如果这份报告不能满足您的要求,我们还可以为您定制报告,请 留言说明您的详细需求。
|