|
|
|
报告导航:研究报告—
生命科学—制药医疗
|
|
2014-2017年中国医疗监护仪行业研究报告 |
 |
字数:2.5万 |
页数:70 |
图表数:86 |
|
中文电子版:6000元 |
中文纸版:3000元 |
中文(电子+纸)版:6500元 |
|
英文电子版:1800美元 |
英文纸版:1900美元 |
英文(电子+纸)版:2100美元 |
|
编号:ZYM061
|
发布日期:2014-12 |
附件:下载 |
 |
|
|
随着医改的推进、消费能力的提高以及医疗保健意识的增强,中国医疗监护仪行业逐渐发展壮大。2007-2013年其市场规模年均复合增长率达21.5%,其中 2013年达46.9亿元。但监护仪普及率仍处于较低的水平,2013年中国监护仪普及率在26.5%,较美国80%水平差距甚远,发展空间较大。预计2017年中国医疗监护仪市场规模将突破百亿元。
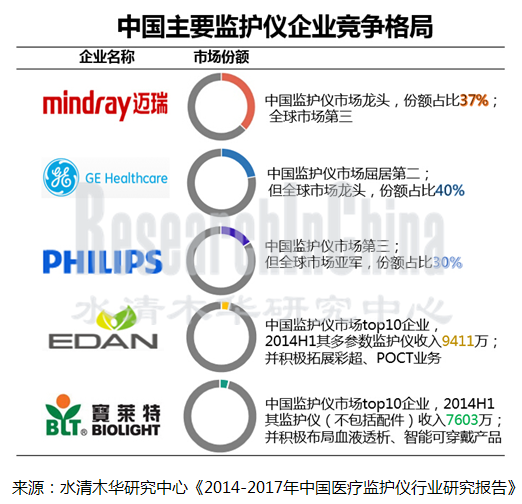
目前大部分中国医疗监护仪企业规模仍较小、研发能力有限,市场集中在迈瑞、飞利浦、GE手中,三家企业合占中国医疗监护仪市场80%左右份额。并且,飞利浦、GE在中国中高端监护仪市场占有绝对优势。不过,外资企业在中国医改大环境下也在不断拓展中低端市场,如GE医疗计划到2015年之前在华实现中高端和基层市场的产品比例各占50%。
迈瑞是中国医疗监护仪行业龙头,2013年其国内市场份额占比约达37%,并正在加大国内高端监护仪市场的拓展。不过,较医学影像、体外诊断等业务发展速度,迈瑞监护仪产品收入增速放缓,其营收比重由2009年的44%下降到2014年前三季度的36%。
宝莱特、理邦医疗一直处于中国监护仪市场第二梯度,市场份额占比小于5%。并且由于监护仪市场竞争日益激烈,且很难超越迈瑞、飞利浦、GE这类巨头,这些企业正加紧公司产品差异化布局。其中宝莱特在巩固医疗监护产品线上,通过并购的方式不断完善血液透析布局域,并已布局智能与移动医疗相结合的可穿戴产品;而理邦医疗则积极拓展彩超和POCT业务,并先后在美国设立2家相关子公司。
《2014-2017年中国医疗监护仪行业研究报告》的内容主要包括以下几方面:
 中国医疗监护仪行业发展现状、市场规模、竞争格局、进出口及发展预测等; 中国医疗监护仪行业发展现状、市场规模、竞争格局、进出口及发展预测等;
中国医疗监护仪行业监管政策、行业政策、进入壁垒、上下游行业对其影响等;
全球4家、中国6家主要监护仪企业经营现状、医疗监护仪业务分析等
With advancement of medical reform, improvement of spending power, and enhancement of health care consciousness, China’s medical monitor industry is gradually expanding. During 2007-2013, the market size grew at a CAGR of 21.5%, to RMB4.69 billion in 2013. However, the medical monitor penetration in China was still at a relatively lower level, at 26.5% in 2013, far below the US level of 80%, reflecting great development potential. It is projected that by 2017 the market size of medical monitor industry in China will exceed RMB10 billion.
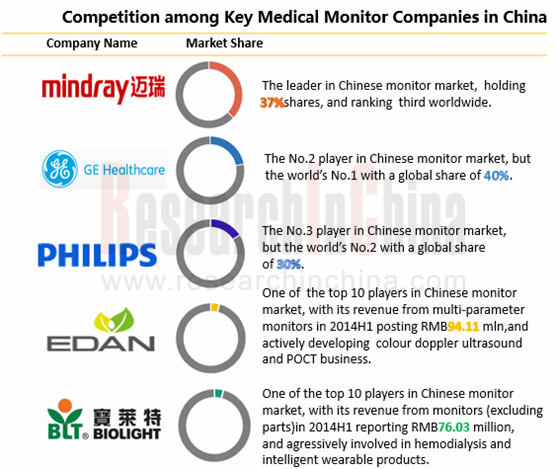
At present, most medical monitor enterprises in China are still very small and have weak R&D capabilities, and the market is dominated by Mindray, Philips, and GE, which occupy a combined share of roughly 80% in China medical monitor market. Moreover, Philips and GE enjoy absolute superiority in Chinese market of medium and high-end monitors. But under the backdrop of medical reform in China, foreign companies are also expanding their presence in medium and low-end market. For example, GE planned to raise the proportion of medium and high-end monitors and low-end ones in China 50%:50% by 2015.
As a leader in China’s medical monitor industry, Mindray took a 37% market share at home in 2013. Currently, the company is stepping up the expansion in China’s high-end monitor market. Compared with medical imaging system and in-vitro Diagnostics, however, Mindray’s revenue from monitoring products showed a slowdwon in growth rate, with the revenue proportion falling from 44% in 2009 to 36% in the first three quarters of 2014.
Biolight and EDAN Instruments have long been among the second echelon of medical monitor market in China, each with market share of less than 5%. Because of the increasingly intense competition in monitor market and difficulty in surpassing such monitor giants as Mindray, Philips, and GE, the second-echelon enterprises are accelerating the differentiated product layout. And Biolight, hoping to consolidate the medical monitoring product line, continuously improved the hematodialysis layout through M&A, and has completed the layout of the wearable products integrating smartness and mobile health care. In comparison, EDAN Instruments aggressively developed color Doppler ultrasound and POCT businesses, and has successively established 2 related subsidiaries in the United States.
Source: China Medical Monitor Industry Report, 2014-2017; ResearchInChina
China Medical Monitor Industry Report, 2014-2017 is primarily concerned with the following:
 Development, market size, competitive landscape, import & export, development prediction of medical monitor industry in China; Development, market size, competitive landscape, import & export, development prediction of medical monitor industry in China;
Regulatory policy, industry policy, access barrier of medical monitors in China and the impact from upstream and downstream sectors, etc.;
Operation and medical monitor business of 4 global and 6 major Chinese monitor manufacturers, etc..
第一章 医疗监护仪行业概述
1.1 定义
1.2 分类
第二章 中国医疗监护仪行业现状
2.1 医疗器械市场
2.2市场规模
2.3 细分产品
2.3.1 多参数监护仪
2.3.2 产科监护仪
2.4进出口
2.4.1 进口情况
2.4.2 出口情况
2.5竞争格局
2.6利润水平
2.7 进入壁垒
2.7.1 市场准入壁垒
2.7.2 技术壁垒
2.7.3 资金壁垒
2.7.4 人才壁垒
2.8 技术水平及趋势
2.8.1 模块化技术
2.8.2 整机技术
2.8.3 信息化技术
第三章 中国医疗监护仪发展环境
3.1 政策环境
3.1.1 产业规划
3.1.2 监管政策
3.1.3 进出口政策
3.2 上下游行业
3.2.1 上游行业
3.2.2 下游行业
第四章 医疗监护仪主要企业
4.1 GE
4.1.1 企业简介
4.1.2 经营情况
4.1.3监护仪业务
4.1.4 在华发展
4.2 Philips
4.2.1 企业简介
4.2.2 经营情况
4.2.3监护仪业务
4.2.4 在华发展
4.3 日本光电
4.3.1 企业简介
4.3.2 经营情况
4.3.3 营收构成
4.3.4监护仪业务
4.3.5 在华业务
4.4 日本福田
4.4.1 企业简介
4.4.2 经营情况
4.4.3 营收构成
4.4.4 监护仪业务
4.4.5 在华业务
4.5迈瑞医疗国际有限公司
4.5.1 企业简介
4.5.2 经营情况
4.5.3 营收构成
4.5.4毛利率
4.5.5研发与投资
4.5.6 医疗监护仪业务
4.5.7 预测与展望
4.6广东宝莱特医用科技股份有限公司
4.6.1 企业简介
4.6.2 经营情况
4.6.3 营收构成
4.6.4 毛利率
4.6.5 研发与投资
4.6.6 医疗监护仪业务
4.6.7 预测与展望
4.7深圳市理邦精密仪器股份有限公司
4.7.1 企业简介
4.7.2 经营情况
6.7.3 营收构成
6.7.4 毛利率
6.7.5 研发
6.7.6 医疗监护仪业务
6.7.7 预测与展望
4.8 深圳科瑞康实业有限公司
4.8.1 企业简介
4.8.2 经营情况
4.9 北京超思电子技术有限公司
4.9.1 企业简介
4.9.2 经营情况
4.9.3 发展情况
4.10 徐州天荣医疗通讯设备有限公司
4.10.1 企业简介
4.10.2 经营情况
4.10.3 发展情况
第五章 总结与预测
5.1 总体市场
5.2 企业分析
1. Overview of Medical Monitor Industry
1.1 Definition
1.2 Classification
2. Status Quo of Medical Monitor Industry
2.1 Medical Device Market
2.2 Market Size
2.3 Product Segments
2.3.1 Multi-parameter Monitor
2.3.2 Obstetric Monitor
2.4 Imports & Exports
2.4.1 Imports
2.4.2 Exports
2.5 Competitive Landscape
2.6 Profitability
2.7 Entry Barriers
2.7.1 Market Access Barriers
2.7.2 Technical Barriers
2.7.3 Capital Barriers
2.7.4 Talent Barriers
2.8 Technological Level and Trend
2.8.1 Modular Technology
2.8.2 Complete Machine Technology
2.8.3 Informatization Technology
3. Development Environment of Medical Monitors in China
3.1 Policy Environment
3.1.1 Industrial Planning
3.1.2 Regulatory Policy
3.1.3 Import & Export Policy
3.2 Upstream and Downstream Sectors
3.2.1 Upstream Sectors
3.2.2 Downstream Sectors
4. Major Medical Monitor Enterprises
4.1 GE
4.1.1 Profile
4.1.2 Operation
4.1.3 Monitor Business
4.1.4 Development in China
4.2 Philips
4.2.1 Profile
4.2.2 Operation
4.2.3Monitor Business
4.2.4 Development in China
4.3 Nihon Kohden Corp.
4.3.1 Profile
4.3.2 Operation
4.3.3 Revenue Structure
4.3.4Monitor Business
4.3.5 Business in China
4.4 Fukuda Denshi Co., Ltd.
4.4.1 Profile
4.4.2 Operation
4.4.3 Revenue Structure
4.4.4 Monitor Business
4.4.5 Business in China
4.5 Mindray Medical International Limited
4.5.1 Profile
4.5.2 Operation
4.5.3 Revenue Structure
4.5.4 Gross Margin
4.5.5 R&D and Investment
4.5.6 Medical Monitor Business
4.5.7 Prediction and Outlook
4.6 Guangdong Biolight Meditech Co., Ltd.
4.6.1 Profile
4.6.2 Operation
4.6.3 Revenue Structure
4.6.4 Gross Margin
4.6.5 R&D and Investment
4.6.6 Medical Monitor Business
4.6.7 Prediction and Outlook
4.7 EDAN Instruments, Inc.
4.7.1 Profile
4.7.2 Operation
6.7.3 Revenue Structure
6.7.4 Gross Margin
6.7.5 R&D
6.7.6 Medical Monitor Business
6.7.7 Prediction and Outlook
4.8 Shenzhen Creative Industry Co., Ltd.
4.8.1 Profile
4.8.2 Operation
4.9 Beijing Choice Electronic Tech Co., Ltd
4.9.1 Profile
4.9.2 Operation
4.9.3 Development
4.10 Tianrong Medical & Communication Equipment Co.,Ltd
4.10.1 Profile
4.10.2 Operation
4.10.3 Development
5. Summary and Forecast
5.1 Market Overview
5.2 Enterprise Analysis
表:医疗监护仪类别及产品
图:2011-2014年中国医疗器械市场规模
图:2006-2014年中国医疗诊断、监护及治疗设备制造企业数
图:2006-2014年中国医疗诊断、监护及治疗设备制造业营业收入及利润
图:2007-2014年中国医疗监护仪行业市场规模
图:2013年中国医疗监护仪市场规模构成(分产品)
图:2007-2014年中国多参数监护仪市场规模
图:2007-2014年中国产科监护仪市场规模
图:2007-2014年中国医疗监护仪进口数量
图:2007-2014年中国医疗监护仪进口金额
图:2007-2014年中国医疗监护仪进口均价
表:2013年中国医疗监护仪进口前十国家进口量、进口额及进口单价(按金额)
图:2007-2014年中国医疗监护仪出口数量
图:2007-2014年中国医疗监护仪出口金额
图:2007-2014年中国医疗监护仪出口均价
表:2013年中国医疗监护仪出口前十国家出口量、出口额及出口单价(按金额)
图:2013年中国各地区医疗监护仪出口额占比
图:2013年中国主要监护仪企业市场份额
表:2007-2013年中国主要医疗监护仪企业毛利率
表:2006-2013年中国医疗监护仪行业产业规划
图:2005-2013年中国医院数量及同比增长
表:2012-2013年中国医疗机构数量及床位数
图:1980-2013年中国卫生费用及所占DGP比重
图:2005-2013年中国医疗保健支出构成
图:2004-2013年中国65岁及以上老年人数量及所占总人口比例
图:2006-2014年中国城镇居民和农村居民家庭人均可支配收入
图:2006-2012年中国城镇居民人均医疗保健支出及占其生活费用占比
图:2006-2012年中国农村居民人均医疗保健支出及占其生活费用占比
表:2009-2014年中国县级医院建设扶持政策
图:2009-2014年GE营业收入及净利润
图:2008-2014年GE医疗业务营收占比
图:2008-2014年GE医疗营业收入及利润
图:2009-2014年飞利浦营业收入及EBIT
表:飞利浦Healthcare业务
图:2009-2014年飞利浦Healthcare营业收入及占比
图:2010-2013年飞利浦Healthcare业务(分产品)营收占比
表:2009-2013年飞利浦Healthcare业务(分地区)营业收入
图:2011-2014年飞利浦在华营业收入及占同期营业收入比重
图:FY2009-FY2014日本光电营业收入及净利润
表:FY2009-FY2014日本光电毛利率
表:FY2009-FY2014日本光电(分产品)营业收入
表:FY2009-FY2014日本光电(分地区)营业收入
图:FY2009-FY2014年日本光电监护仪营业收入及同比增速
图:FY2009-FY2014日本福田营业收入及净利润
表:日本福田业务部门分类
表:FY2009-FY2014日本福田(分产品)营业收入
图:FY2009-FY2014日本福田监护仪营业收入及同比增长
表:日本福田监护仪在华主要产品
图: 截至2014年3月底迈瑞医疗主要子公司
图:2009-2014年迈瑞医疗营业收入及净利润
表:2009-2014年迈瑞医疗(分产品)营业收入
图:2009-2013年迈瑞医疗营业收入构成(按产品)
表:2009-2014年迈瑞(分地区)营业收入
图:2009-2014年迈瑞医疗营业收入构成(按地区)
图:2009-2014年迈瑞医疗毛利率
图:2009-2014年迈瑞医疗研发投入及占营业收入比例
图:2009-2014年迈瑞病人监护与生命支持产品业务营业收入及毛利率
图:2013-2017年迈瑞医疗营业收入及净利润
图:2009-2014年宝莱特营业收入和净利润
图:2009-2014年宝莱特(分产品)营业收入
图:2009-2014年宝莱特(分地区)营业收入
图:2009-2014年宝莱特毛利率
图:2009-2014年宝莱特(分产品)毛利率
图:2010-2014年宝莱特研发投入及所占营收比例
图:2009-2014年宝莱特监护仪业务营业收入及毛利率
表:2009-2013宝莱特(分产品)营业收入及毛利率
图:2013-2017宝莱特营业收入及净利润
图:2009-2014年理邦仪器营业收入和净利润
图:2009-2014年理邦仪器(分产品)营业收入
图:2009-2014年理邦仪器(分地区)营业收入
图:2009-2013年理邦仪器毛利率
表:2009-2014年理邦仪器(分产品)毛利率
图:2011-2014年理邦仪器研发投入及所占营收比例
图:2009-2014年理邦医疗多参数监护仪收入及毛利率
图:2013-2017理邦仪器营业收入和净利润
图:2007-2009年科瑞康营业收入及利润总额
图:2007-2009年科瑞康毛利率
图:2007-2009年科瑞康资产总额及负债总额
图:2007-2009年北京超思营业收入及利润总额
图:2007-2009年北京超思毛利率
图:2007-2009年北京超思资产总额及负债总额
图:2007-2009年天荣医疗营业收入及利润总额
图:2007-2009年天荣医疗毛利率
图:2007-2009年天荣医疗资产总额及负债总额
图:2007-2017年中国医疗监护仪普及率
图:2013-2017年中国医疗监护仪市场规模
Categories of Medical Monitor
Market Size of Medical Devices in China, 2011-2014
Number of Diagnostic, Monitoring, and Therapeutic Equipment Manufacturers in China, 2006-2014
Revenue and Profit of Diagnostic, Monitoring, and Therapeutic Equipment Manufacturing in China, 2006-2014
Market Size of Medical Monitors in China, 2007-2014
Market Structure of Medical Monitors in China by Product, 2013
Market Size of Multi-parameter Monitors in China, 2007-2014
Market Size of Obstetric Monitors in China, 2007-2014
Import Volume of Medical Monitors in China, 2007-2014
Import Value of Medical Monitors in China, 2007-2014
Average Import Price of Medical Monitors in China, 2007-2014
Import Volume, Import Value, and Unit Import Price for China’s Top 10 Medical Monitor Import Sources by Value, 2013
Export Volume of Medical Monitors in China, 2007-2014
Export Value of Medical Monitors in China, 2007-2014
Average Export Price of Medical Monitors in China, 2007-2014
Export Volume, Export Value, and Unit Export Price for China’s Top 10 Medical Monitor Export Destinations by Value, 2013
Proportion of Medical Monitors from Different Chinese Provinces/Municipalities in Total Nationwide by Export Value, 2013
Market Share of Major Medical Monitor Enterprises in China, 2013
Gross Margin of Major Medical Monitor Enterprises in China, 2007-2013
Planning for Medical Monitor Industry in China, 2006-2013
Number and YoY Growth of Hospitals in China, 2005-2013
Number of Medical Institutions and Hospital Beds in China, 2012-2013
China’s Health Expenditure and % of GDP, 1980-2013
China’s Health Care Spending Structure, 2005-2013
Number of Over-65s and % of Total Population in China, 2004-2013
Per Capita Disposable Income of Urban and Rural Households in China, 2006-2014
Per Capita Health Care Spending of Urban Chinese and % of Living Expenses, 2006-2012
Per Capita Health Care Spending of Rural Chinese and % of Living Expenses, 2006-2012
Supportive Policies for Constructing County-level Hospitals, 2009-2014
Revenue and Net Income of GE, 2009-2014
Revenue Structure of GE Healthcare, 2008-2014
Revenue and Profit of GE Healthcare, 2008-2014
Revenue and EBIT of Phillips, 2009-2014
Phillips Healthcare Business
Philips Healthcare’s Revenue and % of Total Revenue, 2009-2014
Revenue Structure of Philips Healthcare by Product, 2010-2013
Revenue of Philips Healthcare by Region, 2009-2013
Revenue of Philips in China and YoY Growth, 2011-2014
Revenue and Net Income of Nihon Kohden Corp., FY2009-FY2014
Gross Margin of Nihon Kohden Corp., FY2009-FY2014
Revenue of Nihon Kohden Corp. by Product, FY2009-FY2014
Revenue of Nihon Kohden Corp. by Region, FY2009-FY2014
Monitor Revenue and YoY Growth of Nihon Kohden Corp., FY2009-FY2014
Revenue and Net Income of Fukuda Denshi, FY2009-FY2014
Business Segments of Fukuda Denshi
Revenue of Fukuda Denshi by Product, FY2009-FY2014
Monitor Revenue and YoY Growth of Fukuda Denshi, FY2009-FY2014
Fukuda Denshi’s Main Monitor Products in China
Major Subsidiaries of Mindray Medical International as of the End of March 2014
Revenue and Net Income of Mindray Medical International, 2009-2014
Revenue of Mindray Medical International by Product, 2009-2014
Revenue Structure of Mindray Medical International by Product, 2009-2013
Revenue of Mindray Medical International by Region, 2009-2014
Revenue Structure of Mindray Medical International by Region, 2009-2014
Gross Margin of Mindray Medical International, 2009-2014
Mindray Medical International’s R&D Costs and % of Total Revenue, 2009-2014
Mindray’s Revenue and Gross Margin of Patient Monitoring & Life Support, 2009-2014
Revenue and Net Income of Mindray Medical International, 2013-2017E
Revenue and Net Income of Biolight, 2009-2014
Revenue of Biolight by Product, 2009-2014
Revenue of Biolight by Region, 2009-2014
Gross Margin of Biolight, 2009-2014
Gross Margin of Biolight by Product, 2009-2014
Biolight’s R&D Costs and % of Total Revenue, 2010-2014
Monitor Revenue and Gross Margin of Biolight, 2009-2014
Revenue and Gross Margin of Biolight by Product, 2009-2013
Revenue and Net Income of Biolight, 2013-2017E
Revenue and Net Income of EDAN Instruments, 2009-2014
Revenue of EDAN Instruments by Product, 2009-2014
Revenue of EDAN Instruments by Region, 2009-2014
Gross Margin of EDAN Instruments, 2009-2013
Gross Margin of EDAN Instruments by Product, 2009-2014
EDAN Instruments’ R&D Costs and % of Total Revenue, 2011-2014
Revenue and Gross Margin of Multi-parameter Monitor of EDAN Instruments, 2009-2014
Revenue and Net Income of EDAN Instruments, 2013-2017E
Revenue and Total Profit of Shenzhen Creative, 2007-2009
Gross Margin of Shenzhen Creative, 2007-2009
Total Assets and Total Liabilities of Shenzhen Creative, 2007-2009
Revenue and Total Profit of Beijing Choice, 2007-2009
Gross Margin of Beijing Choice, 2007-2009
Total Assets and Total Liabilities of Beijing Choice, 2007-2009
Revenue and Total Profit of Tianrong Medical, 2007-2009
Gross Margin of Tianrong Medical, 2007-2009
Total Assets and Total Liabilities of Tianrong Medical, 2007-2009
Penetration of Medical Monitors in China, 2007-2017E
Market Size of Medical Monitors in China, 2013-2017E
如果这份报告不能满足您的要求,我们还可以为您定制报告,请 留言说明您的详细需求。
|