|
|
|
报告导航:研究报告—
金融与服务业—零售与日用
|
|
2014-2017年中国化妆品市场研究报告 |
 |
字数:4.8万 |
页数:158 |
图表数:146 |
|
中文电子版:8500元 |
中文纸版:4250元 |
中文(电子+纸)版:9000元 |
|
英文电子版:2400美元 |
英文纸版:2550美元 |
英文(电子+纸)版:2700美元 |
|
编号:CYH032
|
发布日期:2015-02 |
附件:下载 |
 |
|
|
近年来,中国化妆品市场日趋繁荣,现已成为仅次于美国的全球第二大化妆品消费市场,年零售总额在2000亿元左右。2014年,受经济增速放缓等因素影响,中国化妆品市场增速出现2005年以来最低值,为12.3%,规模以上企业零售总额降至1724.7亿元。
不过,随着消费者对美的不断追求,化妆品销售渠道的日益成熟,以及中国二三线城市需求的不断释放,未来中国化妆品市场将继续保持稳步增长,预计到2017年中国化妆品规模以上企业零售总额有望达到2453亿元。
护肤品、彩妆品是中国消费最多的两类化妆品,2013年其零售总额占比合计为61.2%,其中护肤品占比为48.0%,位居首位。此外,男士护肤观念的改变使得男士化妆品市场不断释放,2013年其零售总额占比达到4.6%,未来这一比重将得到进一步提升。
目前,外资企业仍在中国化妆品市场处于主导地位,约占中国化妆品零售总额的86%左右。近年,为迎合中国化妆品消费者需求以及提高在华市场份额,欧莱雅、雅诗兰黛、宝洁、资生堂等外资企业不断调整品牌战略,加大渠道建设。与此同时,以中国家化、丸美股份等为主的中国本土企业也在加紧化妆品市场布局。
欧莱雅是全球最大的化妆品公司。2013年公司化妆品业务实现营业收入达212.88亿欧元,同比增长2.3%。近几年,欧莱雅不断调整在华品牌战略,2013年初将曾撤出中国的Inneov医学美容口服品再次引入;2014年全面停止品牌卡尼尔在华业务。
雅诗兰黛是全球主要化妆品公司之一,主营护肤品及彩妆。截止到2015年1月底,已在中国51个城市布局124家专柜。除此之外,2014年5月,首次授权中国电商网站天猫,以开拓中国电商渠道市场。
上海家化是中国化妆品主要上市企业,旗下拥有六神、美加净、佰草集及高夫等多个重点品牌。2015年初,公司开始实施青浦基地迁建项目,项目总投资13.55亿元,预计2018年投产,新工厂预计可承担约13万吨配置产量及6亿件灌装产量。
丸美股份是中国主要的本土化妆品企业之一,主营面部和眼部护肤品,旗下有丸美和春纪两大品牌。2013年7月,丸美得到LVHM集团LCapitalAsia投资;2014年6月,拟IPO上市募集资金,实施化妆品生产建设项目,若项目达产,可使公司现有产能扩大至160%。
水清木华研究中心《2014-2017年中国化妆品市场研究报告》着重研究了以下内容:
 中国化妆品市场规模、进出口、产品结构、渠道结构、地区结构、关税政策等; 中国化妆品市场规模、进出口、产品结构、渠道结构、地区结构、关税政策等;
百货、超市、专营店、电商及直销等主要化妆品渠道发展现状、市场规模及发展趋势等;
护肤品、彩妆、香水、男士化妆品及婴童护理用品等主要化妆品细分市场规模、竞争格局、渠道发展情况等;
全球4家化妆品企业经营情况及在华发展;
中国12家化妆品重点企业经营情况及发展战略等。
China’s cosmetics market has been booming in recent years and already become the world’s second largest cosmetics consumer market second only to America, with annual volume of retail sales approximating RMB200 billion. In 2014, influenced by such factors as the economic slowdown, China’s cosmetics market registered the lowest growth rate (12.3%) since 2005; the total volume of retail sales of enterprises (each with annual revenue of above RMB20 million) dropped to RMB172.47 billion.
However, as consumers are in constant pursuit of beauty, cosmetics marketing channels are increasingly mature plus the unceasing release of demand from second- and third-tier cities in China, the Chinese cosmetics market will continue to maintain steady growth in the future, with the total volume of retail sales of enterprises (each with annual revenue of above RMB20 million) expected to be RMB245.3 billion by 2017.
Skin care and make-ups account for the largest share of cosmetics consumption in China, with total volume of retail sales representing a combined 61.2% in 2013, of which skin care products ranked first with a proportion of 48.0%. In addition, the change of men’s skin care concept has led to a constant release of men’s cosmetics market with total volume of retail sales accounting for 4.6% in 2013, and in the future the proportion will be further raised.
So far, foreign-funded enterprises still play a dominant role in China’s cosmetics market, accounting for roughly 86% of the total volume of retail sales. To cater to the demand of Chinese cosmetics consumers and improve their market share in the China, L'Oreal, Estee Lauder, Procter & Gamble, Shiseido and other foreign companies have constantly adjusted brand strategies and intensified the building of channels. Meanwhile, Chinese domestic companies led by Jahwa and Marubi are also stepping up the layout of cosmetics market.
L'Oreal is the world’s largest cosmetics company. In 2013 it recorded revenue of EUR21.288 billion in cosmetics business, a yr-on-yr rise of 2.3%. In recent years, L'Oreal has constantly adjusted its brand strategy in China: re-introduction of Inneov oral medical cosmetics which was withdrawn from China in early 2013; a full suspension of Garnier in China in 2014.
As one of the world’s major cosmetics companies, Estee Lauder is engaged in skin care and make-ups. As of January 2015, it has 124 counters in 51 Chinese cities. Besides, it authorized T-mall, an e-commerce website, for the first time in May 2014 to develop China’s e-commerce channel market.
Shanghai Jahwa, a major listed cosmetics company in China, has SIX GOD, MAXAM, HERBORIST, gf and other priority brands. In early 2015 it embarked on the Qingpu Base Removal Project worth a total of RMB1.355 billion, expected to be put into production in 2018; the new plant can undertake an estimated 130,000-ton configuration production and 600-million-piece filling production.
As one of China’s leading cosmetics companies, MARUBI focuses on facial and eye skin care products, in possession of MARUBI and HARUKI brand. In July 2013, it received LCapitalAsia investment from Louis Vuitton Moët Hennessy (LVHM); in June 2014, it planned IPO placement and implementation of cosmetics production and construction project, which could expand the company’s existing capacity by 160% once reaching designed capacity.
China Cosmetics Market Report, 2014-2017 highlights the followings:
 China’s cosmetics market size, import and export, product structure, channel structure, regional structure, tariff policy, etc.; China’s cosmetics market size, import and export, product structure, channel structure, regional structure, tariff policy, etc.;
Development status, market size and development trend of major cosmetics channels e.g. department store, supermarket, franchised store, e-commerce, direct marketing;
Market size, competition pattern, channel development of major cosmetics segments e.g. skin care, make-ups, perfume, men’s cosmetics, infant & child care products;
Operation and development-in-China of 4 global cosmetics companies;
Operation, development strategy, etc. of 12 Chinese cosmetics companies.
1. 概述
1.1 定义
1.2 分类
2. 中国化妆品市场发展
2.1 市场规模
2.2 进出口
2.2.1 出口
2.2.2 进口
2.3 产品结构
2.4 渠道结构
2.5 地区结构
2.6 企业格局
2.7 关税及政策
3. 化妆品市场渠道分析
3.1 百货专柜
3.1.2 百货专柜渠道特点
3.1.2 百货渠道操作模式
3.1.3 百货渠道发展趋势
3.2 超市
3.2.1 发展现状
3.2.2发展趋势
3.3 专营店
3.3.1 发展现状
3.3.2 渠道拓展方式
3.3.3 发展趋势
3.4 电商
3.4.1 市场规模
3.4.2 电商格局
3.4.3 主要电商
3.5 其他渠道
3.5.1 直销
3.5.2 药店
4. 化妆品细分市场
4.1 护肤品
4.1.1 市场规模
4.1.2 市场结构
4.1.3 竞争格局
4.1.4 大众护肤品
4.2 彩妆类
4.2.1 市场现状
4.2.2 品牌格局
4.2.3 跨国企业彩妆品牌发展动态
4.3 香水
4.3.1 消费现状
4.3.2 竞争格局
4.3.3 进出口
4.3.4 渠道
5. 其他新兴细分市场
5.1 男士化妆品
5.1.1 市场规模
5.1.2 市场结构
5.1.3 竞争格局
5.1.4 渠道
5.1.5 市场特点
5.2 药妆
5.2.1 市场现状
5.2.2 主要企业
5.2.4 渠道
5.3 婴童护理用品
5.3.1 发展现状
5.3.2 行业格局
5.3.3 渠道
6. 全球主要化妆品企业
6.1 欧莱雅
6.1.1 企业简介
6.1.2 经营情况
6.1.3 营收构成
6.1.4 研发
6.1.5 化妆品业务
6.1.6 在华发展
6.2 雅诗兰黛
6.2.1 企业简介
6.2.2 经营情况
6.2.3 营收构成
6.2.4 研发
6.2.5 销售渠道
6.2.6 在华发展
6.3 宝洁
6.3.1 企业简介
6.3.2 经营情况
6.3.3 营收构成
6.3.4 毛利率
6.3.5 研发
6.3.6 化妆品业务
6.3.7 渠道
6.3.8 在华发展
6.4 资生堂
6.4.1 企业简介
6.4.2 经营情况
6.4.3 营收构成
6.4.4 渠道
6.4.5 研发
6.4.6 化妆品业务
6.4.7 在华发展
7. 中国主要化妆品企业
7.1 上海家化联合股份有限公司(600315)
7.1.1 企业简介
7.1.2 经营情况
7.1.3 营收构成
7.1.4 毛利率
7.1.5 渠道
7.1.6 品牌
7.1.7 发展前景
7.2 江苏隆力奇生物科技股份有限公司
7.2.1 企业简介
7.2.2 经营情况
7.2.3 渠道
7.3 上海相宜本草化妆品股份有限公司
7.3.1 企业简介
7.3.2 经营情况
7.3.3 营收构成
7.3.4 毛利率
7.3.5 渠道
7.3.6 产销量
7.4 伽蓝集团股份有限公司
7.4.1 企业简介
7.4.2 经营情况
7.4.3 渠道
7.4.4 自然堂
7.5 浙江欧诗漫集团有限公司
7.5.1 企业简介
7.5.2 经营情况
7.5.3 渠道建设
7.5.4 旗下品牌
7.6 珀莱雅化妆品股份有限公司
7.7 天津郁美净集团有限公司
7.8 索芙特股份有限公司(000662)
7.8.1 企业简介
7.8.2 经营情况
7.8.3 营收构成
7.8.4 毛利率
7.8.5 发展动态
7.9 霸王国际(集团)控股有限公司
7.9.1 企业简介
7.9.2 经营情况
7.9.3 营收构成
7.9.4 品牌
7.9.5 渠道
7.9.6 发展前景
7.10 广州环亚化妆品科技有限公司
7.10.1 品牌与渠道
7.10.2 投资与项目建设
7.11 广东丸美生物技术股份有限公司
7.11.1 企业简介
7.11.2 经营情况
7.11.3 营收构成
7.11.4 渠道
7.11.5 产销量
7.11.6 品牌
7.11.7 建设项目
7.12 高丝化妆品有限公司
8. 结论与预测
8.1 企业与品牌
8.1.1 企业
8.1.2 品牌
8.1.3 外资在华发展
8.2 预测
1. Overview
1.1 Definition
1.2 Classification
2. Development of China Cosmetics Market
2.1 Market Size
2.2 Import and Export
2.2.1 Export
2.2.2 Import
2.3 Product Structure
2.4 Channel Structure
2.5 Regional Structure
2.6 Enterprise Pattern
2.7 Duties and Policies
3. Cosmetics Market Channels
3.1 Department Store
3.1.2 Characteristics
3.1.2 Mode of Operation
3.1.3 Development Trend
3.2 Supermarket
3.2.1 Development Status
3.2.2 Development Trend
3.3 Franchised Store
3.3.1 Development Status
3.3.2 Mode of Channel Development
3.3.3 Development Trend
3.4 E-commerce
3.4.1 Market Size
3.4.2 E-commerce Pattern
3.4.3 Main E-commerce
3.5 Others
3.5.1 Direct Marketing
3.5.2 Drugstore
4. Cosmetics Market Segments
4.1 Skin Care
4.1.1 Market Size
4.1.2 Market Structure
4.1.3 Competition Pattern
4.1.4 Mass Products
4.2 Make-ups
4.2.1 Market Status
4.2.2 Brand Pattern
4.2.3 Developments of Multinational Enterprises
4.3 Perfume
4.3.1 Consumption Status
4.3.2 Competition Pattern
4.3.3 Import and Export
4.3.4 Channel
5. Other Emerging Market Segments
5.1 Men's Cosmetics
5.1.1 Market Size
5.1.2 Market Structure
5.1.3 Competition Pattern
5.1.4 Channel
5.1.5 Market Characteristics
5.2 Cosmeceuticals
5.2.1 Market Status
5.2.2 Major Enterprise
5.2.3 Channel
5.3 Infant & Child Care Product
5.3.1 Development Status
5.3.2 Industry Structure
5.3.3 Channel
6. Major Cosmetics Companies Worldwide
6.1 L'Oreal
6.1.1 Profile
6.1.2 Operation
6.1.3 Revenue Structure
6.1.4 R&D
6.1.5 Cosmetics Business
6.1.6 Development in China
6.2 Estee Lauder
6.2.1 Profile
6.2.2 Operation
6.2.3 Revenue Structure
6.2.4 R&D
6.2.5 Distribution Channel
6.2.6 Development in China
6.3 Procter & Gamble
6.3.1 Profile
6.3.2 Operation
6.3.3 Revenue Structure
6.3.4 Gross Margin
6.3.5 R&D
6.3.6 Cosmetics Business
6.3.7 Channel
6.3.8 Development in China
6.4 Shiseido
6.4.1 Profile
6.4.2 Operation
6.4.3 Revenue Structure
6.4.4 Channel
6.4.5 R&D
6.4.6 Cosmetics Business
6.4.7 Development in China
7. Major Cosmetic Companies in China
7.1 Shanghai Jahwa United Co., Ltd. (600315)
7.1.1 Profile
7.1.2 Operation
7.1.3 Revenue Structure
7.1.4 Gross Margin
7.1.5 Channel
7.1.6 Brand
7.1.7 Development Prospect
7.2 Jiangsu LONGLIQI Bio-Science Co., Ltd. (Longrich)
7.2.1 Profile
7.2.2 Operation
7.2.3 Channel
7.3 Shanghai Inoherb Cosmetics Co., Ltd.
7.3.1 Profile
7.3.2 Operation
7.3.3 Revenue Structure
7.3.4 Gross Margin
7.3.5 Channel
7.3.6 Production and Sales
7.4 JALA Corporation
7.4.1 Profile
7.4.2 Operation
7.4.3 Channel
7.4.4 Chcedo
7.5 Zhejiang Osmun Group
7.5.1 Profile
7.5.2 Operation
7.5.3 Channel Construction
7.5.4 Brand
7.6 Zhejiang Proya Cosmetics Co., Ltd
7.7 Tianjin Yumeijing Group Co., Ltd.
7.8 Softto Co., Ltd. (000662)
7.8.1 Profile
7.8.2 Operation
7.8.3 Revenue Structure
7.8.4 Gross Margin
7.8.5 Developments
7.9 BaWang International (Group) Holding Limited
7.9.1 Profile
7.9.2 Operation
7.9.3 Revenue Structure
7.9.4 Brand
7.9.5 Channel
7.9.6 Development Prospect
7.10 Guangzhou Huanya Cosmetics Technology Co., Ltd.
7.10.1 Brand and Channel
7.10.2 Investment and Project Construction
7.11 Guangdong Marubi Biotechnology Co., Ltd.
7.11.1 Profile
7.11.2 Operation
7.11.3 Revenue Structure
7.11.4 Channel
7.11.5 Production and Sales
7.11.6 Brand
7.11.7 Construction Project
7.12 KOSé Corporation
8. Conclusion and Forecast
8.1 Enterprise and Brand
8.1.1 Enterprise
8.1.2 Brand
8.1.3 Foreign-Capital Development in China
8.2 Forecast
表:化妆品分类
图:2005-2014年中国化妆品零售额及同比增速
图:2011-2014年中国化妆品出口量及出口额
图:2011-2014年中国化妆品进口量及进口金额
图:2013-2014年中国化妆品(分产品)零售额结构
图:2010-2014年中国化妆品(分渠道)零售总额构成
图:2014年中国化妆品消费零售额(分地区)构成
图:2013年中国化妆品企业结构
表:2015年中国主要化妆品关税税率
表:2007-2015年中国化妆品相关政策
表:中国化妆品各销售渠道情况比较
表:2014年中国化妆品(分企业/分品牌)渠道分布
表:化妆品百货渠道操作模式
表:2012&2015年中国主要化妆品专营店及在大陆店铺数量
表:2003-2014年跨国品牌渗透专营店渠道的阶段
图:2008-2017年中国化妆品网购市场交易规模及同比增长
图:2013年中国化妆品电商成本构成
图:2014年中国消费者网上购买化妆品主要考虑因素
表:中国化妆品网络销售渠道分析
表:2011-2013年中国主要直销化妆品企业在中国直销收入
图:2009-2017年中国护肤品市场规模及同比增长
图:2013年中国护肤品(分产品)市场销售额构成
图:2013年中国美白产品在各品类中占比
表:2014年中国面膜市场(按价格)分类
表:2009-2014年中国面膜市场领先品牌
表:2012年中国化妆品市场Top10护肤品品牌零售额及市场份额
图:中国化妆品市场(按价位)品牌分布(RMB)
表:大众护肤品代表品牌
图:2006-2017年中国彩妆市场规模
图:2013年中国消费者彩妆用途关注度
图:2014年中国彩妆Top10品牌数字资产价值
表:2013年中国香水Top10企业及市场份额
图:2008-2014年中国香水及花露水进口数量及进口金额
图:2008-2014年中国香水及花露水出口数量及金额
图:2014年中国男士化妆品市场结构
表:中国男士化妆品品牌格局
图:2013年男士产品渠道格局
图:2013年中国药妆(分领域)销售额构成
表:中国涉足药妆生产的企业及产品
表:儿童产品行业格局
图:2010-2014年婴童化妆品渠道格局
图:2006-2014年欧莱雅营业收入与净利润
表:2011-2014年欧莱雅(分业务)营业收入及构成
表:2011-2014年欧莱雅(分地区)营业收入及构成
图:2008-2014年欧莱雅研发投入及占比
图:2009-2014年欧莱雅化妆品业务营业收入与营业利润
表:2011-2014年欧莱雅化妆品业务(分部门)营业收入及构成
图:2010-2013年欧莱雅化妆品(分业务)营业收入构成
表:2011-2014年欧莱雅化妆品业务(分地区)营业收入及构成
图:2012年欧莱雅化妆品业务(分地区)产量占比
图:2007-2013年欧莱雅在中国营业收入
表:截至2015年1月底欧莱雅在中国(分品牌/分城市)专柜分布
图:2008-2015财年雅诗兰黛净收入及营业利润
图:2008-2015财年雅诗兰黛(分产品)净收入
图:2008-2015财年雅诗兰黛(分地区)营业收入
图:FY2010-FY2014年雅诗兰黛研发投入及占比
图:2014财年雅诗兰黛(分销商渠道)净收入构成
表:雅诗兰黛在华发展主要事件
表:截至2015年1月底雅诗兰黛在中国专柜数量
图:2015年宝洁公司各业务部门品牌分布
图:2008-2015财年宝洁净收入及净收益
表:2012-2014财年宝洁(分业务)净收入及构成
图:2011-2014财年宝洁(分地区)净收入占比
图:2008-2014财年宝洁毛利率
图:2008-2014财年宝洁研发投入及占比
表:宝洁化妆品业务分类及品牌
图:2010-2014财年宝洁化妆品业务净收入及净收益
表:宝洁在中国品牌分布
表:截止到2015年1月底SK-II品牌在中国专柜分布
图:2007-2014财年资生堂净收入及净利润
表:2010-2014财年资生堂(分产品)收入及构成
图:2008-2014财年资生堂(分地区)净收入
图:2008-2014财年资生堂海外收入及占比
图:资生堂在日本销售渠道分布
表:2014财年资生堂(分品牌)渠道分布
图:2008-2013财年资生堂研发投入及占比
图:资生堂(分国家)研发机构分布
图:资生堂化妆品业务分类
图:品牌SHISEIDO国家分布
图:2010-2014年资生堂在中国净收入
表:2014财年资生堂在中国的子公司
图:2008-2014年上海家化营业收入及净利润
图:2013-2014年上海家化(分业务)主营业务收入
表:2013-2014年上海家化(分地区)主营业务收入
图:2012-2014年上海家化(分业务)毛利率
表:上海家化(分品牌)定位及主要销售渠道
图:2013-2014年上海家化(分渠道)销售收入构成
表:2012-2013年上海家化(分品牌)毛利润
图:上海家化主要化妆品品牌
表:上海家化主要品牌价位
表:2012&2014年六神(分产品)市场份额
图:2001-2009年美加净手部护理产品市场份额
图:佰草集品牌产品
表:2013-2017年上海家化营业收入与净利润
表:隆力奇旗下主要品牌
表:2002-2015年隆力奇发展概况
表:隆力奇全球科研中心
图:2009-2014年隆力奇营业收入
图:2009-2014年相宜本草营业收入与净利润
表:2009-2012年相宜本草(分产品)营业收入及构成
图:2009-2012年相宜本草(分地区)营业收入
表:2009-2012年相宜本草(分产品)毛利率
图:2011&2013年相宜本草(分渠道)收入构成
表:相宜本草产品渠道模式及销售终端
表:截至2015年1月底相宜本草在中国大陆专柜分布
表:2009-2011年相宜本草产品(分工厂)生产产能
表:2009-2011年相宜本草(分产品)产销量
表:伽蓝集团生产基地
图:2011-2014年伽蓝集团销售额
表:截至2015年1月底自然堂在中国大陆专柜分布
图:2010-2014年欧诗漫销售额
图:2014年1-11月珀莱雅(分品牌)百货渠道零售额增长率
表:截至2015年1月底珀莱雅中国大陆(分城市)专柜数量
图:2007-2014年郁美净集团营业收入
图:2008-2014年索芙特营业收入与净利润
表:2008-2014年索芙特(分产品)主营业务收入
表:2008-2014年索芙特(分产品)毛利率
图:2008-2014年霸王营业收入及净利润
表:2012-2014年霸王(分产品)营业收入及构成
表:2012-2013年霸王(分地区)营业收入及构成
表:霸王品牌分布
表:2011-2014年霸王(分品牌)营业收入与构成
表:2013-2014年霸王集团(分品牌)渠道分布
图:霸王集团发展目标
表:2012-2015年广州环亚化妆品公司化妆品品牌及产品发展动态
图:广州环亚化妆品公司品牌
图:2011-2013年广东丸美生物公司营业收入与净利润
表:2011-2013年丸美公司(分产品)营业收入与构成
表:2011-2013年丸美公司(分地区)营业收入及构成
表:2011-2013年丸美(分渠道)营业收入及构成
表:截至2013年底丸美按销售额经销商数量
表:截至2013年底丸美(分区域/分形式)终端网点数量
表:2011-2013年丸美产能与产能利用率
表:2011-2013年丸美(分产品)产销量与产销率
表:2011-2013年丸美(分品牌)营业收入及构成
表:2011-2013年丸美公司品牌丸美(分产品)营业收入及构成
表:2011-2013年春纪品牌(分产品)营业收入及构成
表:2014年广东丸美生物科技股份有限公司募投项目概况
表:2014年高丝化妆品(分渠道)品牌分布
图:2007-2010年高丝化妆品有限公司主营业务收入
图:2013-2014中国化妆品企业营业收入
表:2013-2014年中国本土化妆品融资事件
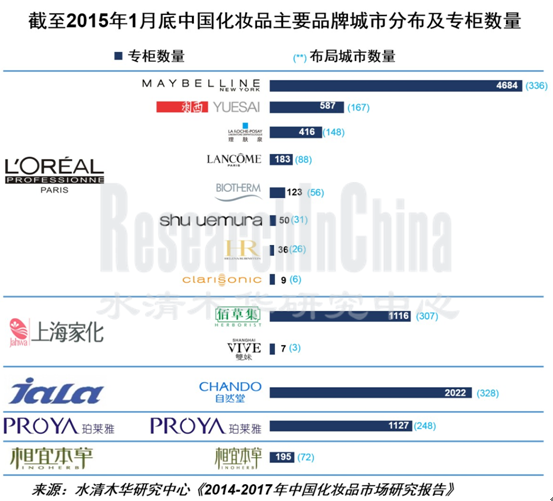
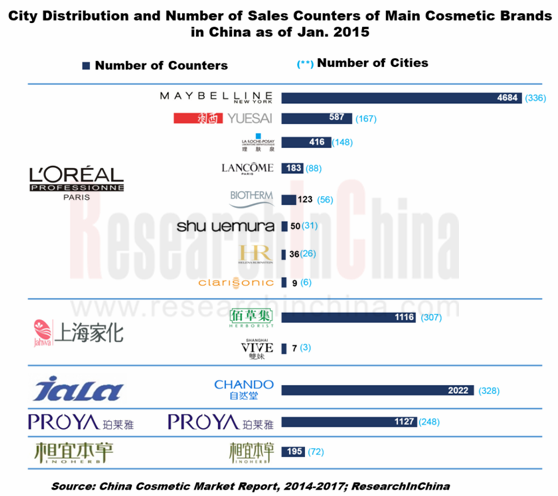
表:截至2015年1月底中国化妆品主要品牌(分城市)专柜数量
表:2013-2014年化妆品跨国企业在华发展比较
表:2003-2014年国际企业并购中国本土化妆品品牌及发展动态
表:2013-2017年中国规模以上化妆品零售总额及同比增长
Classification of Cosmetics
Retail Sales and YoY Growth of Cosmetics in China, 2005-2014
Import Volume and Value of Cosmetics in China, 2011-2014
Export Volume and Value of Cosmetics in China, 2011-2014
Retail Sales Structure of Cosmetics in China (by Product), 2013-2014
Total Retail Sales Structure of Cosmetics in China (by Channel), 2010-2014
Retail Sales Structure of Cosmetics Consumption in China (by Region), 2014
Cosmetics Enterprise Structure in China, 2013
Customs Duty Rates of Main Cosmetics in China, 2015
Policies Regarding Cosmetics in China, 2007-2015
Comparison of Distribution Channels of Cosmetics in China
Channel Distribution of Cosmetics in China (by Enterprise / Brand), 2014
Operation Model of Department Store as a Sales Channel for Cosmetics
Number of Major Cosmetics Franchise Stores and Shops in Mainland China, 2012&2015
Stage of Multinational Brand Penetrating Franchised Store Channel, 2003-2014
Transaction Size and YoY Growth of China Cosmetics Online Shopping Market, 2008-2017E
Cost Structure of Cosmetics E-commerce in China, 2013
Consideration of Purchasing Cosmetics Online in China, 2014
Online Marketing Channel of Cosmetics in China
Direct Selling Income of Top Chinese Directing Selling Cosmetics Companies in China, 2011-2013
China’s Skin Care Market Size and YoY Growth, 2009-2017E
China’s Skin Care Market Sales Structure (by Product), 2013
Proportion of Whitening Product in China, 2013
Classification of China Facial Mask Market (by Price), 2014
Leading Brands of China Facial Mask Market, 2009-2014
Retail Sales and Market Share of Top 10 Skin Care Brands in China Cosmetics Market, 2012
Brand Distribution of China Cosmetics Market (by Price) (RMB)
Representative Brands of Mass Skin Care
China’s Make-up Market Size, 2006-2017E
Make-up Use Attention of Chinese Consumers, 2013
Digital Asset Value of Top 10 Chinese Make-up Brands, 2014
Top 10 Chinese Perfume Enterprises and Their Market Share, 2013
China’s Import Volume and Value of Perfume and Floral Water, 2008-2014
China’s Export Volume and Value of Perfume and Floral Water, 2008-2014
China Men’s Cosmetics Market Structure, 2013
China Men’s Cosmetics Brand Pattern
Channel Pattern of Men’s Product, 2013
China’s Cosmeceuticals Sales Structure (by Field), 2013
Products of Chinese Companies Involved in Cosmeceuticals Production
Industry Pattern of Children’s Product
Channel Pattern of Infant & Child Cosmetics, 2010-2014
Revenue and Net Income of L'Oreal, 2006-2014
Revenue Breakdown and Structure of L'Oreal (by Business), 2011-2014
Revenue Breakdown and Structure of L'Oreal (by Region), 2011-2014
R&D Costs and % of Total Revenue of L'Oreal, 2008-2014
Cosmetics Revenue and Operating Income of L'Oreal, 2009-2014
Cosmetics Revenue Breakdown and Structure of L'Oreal (by Department), 2011-2014
Cosmetics Revenue Structure of L'Oreal (by Business), 2010-2013
Cosmetics Revenue Breakdown and Structure of L'Oreal (by Region), 2011-2014
Cosmetics Production Structure of L'Oreal (by Region), 2012
Revenue of L'Oreal in China, 2007-2013
Distribution of L'Oreal Counters in China (by Brand/City) as of Jan 2015
Net Revenue and Operating Income of Estee Lauder, FY2008-FY2015E
Net Revenue Breakdown of Estee Lauder (by Product), FY2008-FY2015E
Revenue Breakdown of Estee Lauder (by Region), FY2008-FY2015E
R&D Costs and % of Total Revenue of Estee Lauder, FY2010-FY2014
Net Revenue Structure of Estee Lauder (by Dealer Channel), FY2014
Main Events of Estee Lauder in China
Number of Estee Lauder Counters in China as of Jan 2015
Brand Distribution of Procter & Gamble by Department, 2015
Net Revenue and Net Income of Procter & Gamble, FY2008-FY2015E
Net Revenue Breakdown and Structure of Procter & Gamble (by Business), FY2012-FY2014
Net Income Structure of Procter & Gamble (by Region), FY2011-FY2014
Gross Margin of Procter & Gamble, FY2008-FY2014
R&D Costs and % of Total Revenue of Procter & Gamble, FY2008-FY2014
Cosmetics Classification and Brand of Procter & Gamble
Net Revenue and Net Income of Cosmetics Business of Procter & Gamble, FY2010-FY2014
Brand Distribution of Procter & Gamble in China
Distribution of SK-II Counters in China as of Jan 2015
Net Revenue and Net Income of Shiseido, FY2007-FY2014
Revenue Breakdown and Structure of Shiseido (by Product), FY2010-FY2014
Net Revenue Breakdown of Shiseido (by Region), FY2008-FY2014
Overseas Revenue and % of Total Revenue of Shiseido, FY2008-FY2014
Sales Channel Distribution of Shiseido in Japan
Channel Distribution of Shiseido (by Brand), FY2014
R&D Costs and % of Total Revenue of Shiseido, FY2008-FY2013
Distribution of Shiseido’s Research Institutes (by Country)
Cosmetics Classification of Shiseido
Brand Distribution of Shiseido (by Country)
Net Revenue of Shiseido in China, 2010-2014
Subsidiaries of Shiseido in China, FY2014
Revenue and Net Income of Shanghai Jahwa, 2008-2014
Operating Revenue Breakdown of Shanghai Jahwa (by Business), 2013-2014
Operating Revenue Breakdown of Shanghai Jahwa (by Region), 2013-2014
Gross Margin of Shanghai Jahwa (by Business), 2012-2014
Positioning (by Brand) and Main Sales Channels of Shanghai Jahwa
Sales Structure of Shanghai Jahwa (by Channel), 2013-2014
Gross Profit of Shanghai Jahwa (by Brand), 2012-2013
Main Cosmetics Brand of Shanghai Jahwa
Main Brand Price of Shanghai Jahwa
Market Share of SIX GOD (by Product), 2012&2014
Market Share of MAXAM Hand Care, 2001-2009
HERBORIST Brand Product
Revenue and Net Income of Shanghai Jahwa, 2013-2017E
Main Brand of Longrich
Development of Longrich, 2002-2015
Global Research Center of Longrich
Revenue of Longrich, 2009-2014
Revenue and Net Income of INOHERB, 2009-2014
Revenue Breakdown and Structure of INOHERB (by Product), 2009-2012
Revenue Breakdown of INOHERB (by Region), 2009-2012
Gross Margin of INOHERB (by Product), 2009-2012
Revenue Structure of INOHERB (by Channel), 2011&2013
Channel Model and Sales Terminal of INOHERB Product
Distribution of INOHERB Counters in Mainland China as of Jan 2015
Production Capacity of INOHERB Product (by Factory), 2009-2011
Output and Sales Volume of INOHERB (by Product), 2009-2011
Production Base of JALA Corporation
Sales of JALA Corporation, 2011-2014
Distribution of Chcedo Counters in Mainland China as of Jan 2015
Sales of Osmun, 2010-2014
Retail Sales Growth of Department Store Channel of Proya (by Brand), Jan-Nov 2014
Number of Proya Counters in Mainland China (by City) as of Jan 2015
Revenue of Tianjin Yumeijing Group, 2007-2014
Revenue and Net Income of Softto, 2008-2014
Operating Revenue Breakdown of Softto (by Product), 2008-2014
Gross Margin of Softto (by Product), 2008-2014
Revenue and Net Income of BaWang, 2008-2014
Revenue Breakdown and Structure of BaWang (by Product), 2012-2014
Revenue Breakdown and Structure of BaWang (by Region), 2012-2013
Brand Distribution of BaWang
Revenue Breakdown and Structure of BaWang (by Brand), 2011-2014
Channel Distribution of BaWang (by Brand), 2013-2014
Development Target of BaWang International (Group) Holding Limited
Cosmetics Brand and Product Development of Guangzhou Huanya Cosmetics Technology, 2012-2015
Brand of Guangzhou Huanya Cosmetics Technology
Revenue and Net Income of Guangdong Marubi Biotechnology, 2011-2013
Revenue Breakdown and Structure of Marubi (by Product), 2011-2013
Revenue Breakdown and Structure of Marubi (by Region), 2011-2013
Revenue Breakdown and Structure of Marubi (by Channel), 2011-2013
Dealers of Marubi (by Sales) as of end-2013
Terminal Sales Points of Marubi (by Region/Form) as of end-2013
Capacity and Capacity Utilization of Marubi, 2011-2013
Output, Sales Volume and Sales-Output Ratio of Marubi (by Product), 2011-2013
Revenue Breakdown and Structure of Marubi (by Brand), 2011-2013
Revenue Breakdown and Structure of Marubi® (by Product), 2011-2013
Revenue Breakdown and Structure of CAC® (by Product), 2011-2013
Fundraising Project Overview of Guangdong Marubi Biotechnology, 2014
Brand Distribution of KOSé Cosmetics (by Channel), 2014
Operating Revenue of KOSé Corporation, 2007-2010
Revenue of Cosmetics Companies in China, 2013-2014
Local Cosmetics Financing Events in China, 2013-2014
Counters of Main Cosmetics Brands in China (by City) as of Jan 2015
Comparison of Development-in-China of Multinational Cosmetics Companies, 2013-2014
M&A of Local Cosmetics Brands by Foreign Companies and Developments, 2013-2014
Total Retail Sales and YoY Growth of Chinese Cosmetics Companies above Designated Size, 2013-2017E
如果这份报告不能满足您的要求,我们还可以为您定制报告,请 留言说明您的详细需求。
|