|
|
|
报告导航:研究报告—
制造业—材料
|
|
2016-2020年全球及中国锂电池负极材料行业研究报告 |
 |
字数:3.7万 |
页数:133 |
图表数:145 |
|
中文电子版:8000元 |
中文纸版:4000元 |
中文(电子+纸)版:8500元 |
|
英文电子版:2400美元 |
英文纸版:2600美元 |
英文(电子+纸)版:2700美元 |
|
编号:HK068
|
发布日期:2016-03 |
附件:下载 |
 |
|
|
锂电池主要由正极材料、负极材料、隔膜和电解液构成,其中负极材料在锂电池中的成本占比为5%-15%,是锂电池的重要原材料之一。
2015年,全球锂电池负极材料销量达11.27万吨,产地主要为中国和日本。未来5年,随着新能源汽车销量的逐年攀升,预计全球锂电池负极材料销量仍将保持25%以上的增长速度。
目前,全球锂电池负极材料仍然以天然石墨和人造石墨为主,2015年占比达83%左右。但是随着动力电池的需求提升,新型材料如中间相炭微球(MCMB)、钛酸锂(LTO)、硅碳(Si/C)、硬碳/软碳等负极材料产量也在快速增长。
近年来,受益于中国新能源汽车市场的爆发,负极材料销量快速增长,增速明显快于全球平均水平。2015年,中国负极材料销量达7.28万吨,同比增长42.7%,预计未来5年复合增长率仍将达到30%以上。
全球负极材料市场由日本和中国的企业占据,其中日本企业在技术水平方面处于领先地位,而中国由于石墨矿产资源丰富,在负极材料生产方面成本优势明显。
2015年,全球负极材料市场份额(按销量)排名前六的企业分别为贝特瑞、日立化成、杉杉股份、三菱化学、日本碳素和日本JFE,市场份额之和接近70%。其中日立化成、杉杉科技、日本碳素和日本JFE以人造石墨为主,贝特瑞、三菱化学以天然石墨为主。
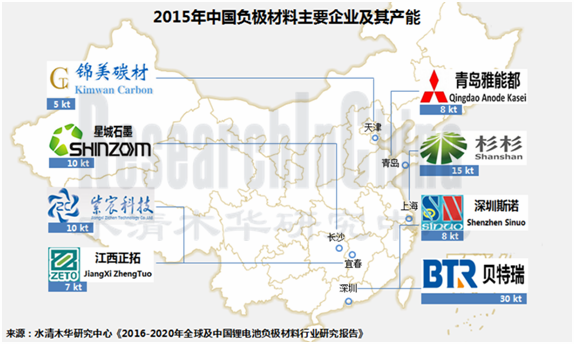
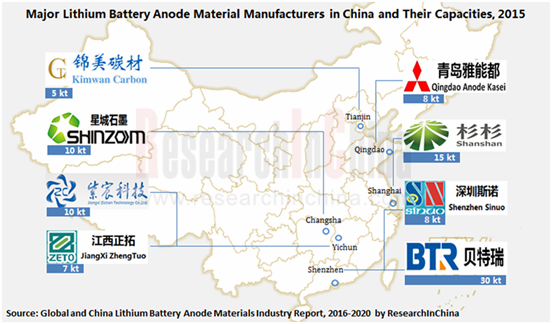
截止2015年底,中国从事锂电池负极材料生产的企业达50余家,大部分是2010年之后新进入该行业。其中负极材料产能达万吨以上的企业有贝特瑞、上海杉杉、江西紫宸、星城石墨4家,产能分别为3万吨、1.5万吨、1万吨和1万吨。未来几年,随着中国企业负极材料产能的持续扩大及工艺技术的提升,其负极材料市场占有率将会继续上升。
水清木华研究中心《2015-2020年全球及中国锂电池负极材料行业研究报告》主要包括以下几个内容:
 全球锂电池负极材料行业市场规模及预测、竞争格局、新型负极材料发展情况等; 全球锂电池负极材料行业市场规模及预测、竞争格局、新型负极材料发展情况等;
中国锂电池负极材料行业产业政策、市场规模及预测、竞争格局、价格走势等;
全球及中国负极材料上游原料行业(石墨、碳化硅、钛酸锂、石墨烯等)市场规模、竞争格局、进出口、价格走势等
全球及中国锂电池行业市场规模、竞争格局、对负极材料需求分析及预测等;
全球及中国15家负极材料生产企业简介、负极材料业务分析、经营状况等;
全球及中国3家钛酸锂材料生产企业简介、钛酸锂材料业务分析、经营状况等。
Lithium battery is primarily composed of cathode materials, anode materials, separator, and electrolyte. Anode materials, one of vital raw materials, make up 5%-15% of lithium battery cost.
In 2015, global lithium battery anode materials sales amounted to 112,700 tons, mainly produced in China and Japan. As new energy vehicle sales climb year after year, global lithium battery anode materials sales is expected to maintain a growth rate of over 25% over the next five years.
Global lithium battery anode materials are still dominated by natural graphite and artificial graphite, together accounting for roughly 83% in 2015. However, as the demand for power battery rises, novel materials like mesocarbon microbeads (MCMB), lithium titanate (LTO), silicon carbon (Si/C), hard/soft carbon, and other anode materials see rapid growth in output.
In recent years, thanks to explosive growth of the Chinese new energy vehicle market, anode materials sales has burgeoned in China, significantly faster than the global average. China’s anode materials sales reached 72,800 tons in 2015, a year-on-year surge of 42.7%, and are expected to record a CAGR of more than 30% over the next five years.
Global anode materials market is occupied mainly by Japanese and Chinese enterprises, with the former leading the way technologically, and the latter having advantage of low production cost because of rich graphite mineral resources in the country.
In 2015, global top6 anode materials companies (by sales volume) were BTR, Hitachi Chemical, Shanghai Shanshan, MitshubishiChem, Nippon Carbon, and JFE, together holding nearly 70% market share. Hitachi Chemical, Shanghai Shanshan, Nippon Carbon, and JFE focus on artificial graphite, and BTR and Hitachi Chemical specialize in natural graphite.
There had been more than 50 lithium battery anode materials producers in China by the end of 2015, mostly new entrants after 2010. The companies boasting anode materials capacity of over 10,000 tons included BTR (30,000t/a), Shanghai Shanshan Tech (15,000t/a), Jiangxi Zichen Technology (10,000t/a), and Hunan Shinzoom Technology (10,000t/a). As Chinese companies continue to boost anode materials capacity and improve technologies, the domestic market share of anode materials produced by local players will continue to rise over the next couple of years.
Global and China Lithium Battery Anode Materials Industry Report, 2016-2020 by ResearchInChina highlights the followings:
 Global lithium battery anode materials industry (market size and forecast, competitive pattern, development of new anode materials, etc.); Global lithium battery anode materials industry (market size and forecast, competitive pattern, development of new anode materials, etc.);
China’s lithium battery anode materials industry (policies, market size & forecast, competitive pattern, price trend, etc.);
Global and China’s raw materials industry (graphite, silicon carbide, LTO, graphene) of anode materials (market size, competitive pattern, import & export, price trend, etc.);
Global and China’s lithium battery industry (market size, competitive pattern, demand for anode materials and forecast, etc.);
15 Global and Chinese anode materials producers (profile, anode materials business, operation, etc.);
3 Global and Chinese lithium titanate producers (profile, lithium titanate business, operation, etc.).
第一章 锂电池负极材料概述
1.1 定义
1.2产业链
第二章 锂电池负极材料市场分析
2.1 市场规模
2.2 竞争格局
2.3 新型负极材料
2.3.1 钛酸锂
2.3.2 硬碳/软碳
2.3.3 硅基复合材料
2.3.4 石墨烯
第三章 中国锂电池负极材料市场分析
3.1 产业政策
3.2 市场规模
3.3 竞争格局
3.4 价格走势
第四章 上游原料市场概况
4.1 石墨
4.1.1 全球市场
4.1.2 中国市场
4.2 碳化硅
4.2.1 全球市场
4.2.2 中国市场
4.3 钛酸锂
4.3.1 全球市场
4.3.2 中国市场
4.4 石墨烯
4.5 硬炭/软碳
4.6 中间相炭微球
第五章 下游锂电池市场概况
5.1 市场规模
5.1.1 全球
5.1.2 中国
5.2 市场结构
5.2.1 全球
5.2.2 中国
5.3 竞争格局
5.3.1 全球
5.3.2 中国
5.4 需求分析
5.4.1 消费电子(3C)
5.4.2 电动汽车
5.4.3 工业储能
第六章 全球负极材料重点企业
6.1 日立化成
6.1.1 基本介绍
6.1.2 发展历程及展望
6.1.3 生产基地
6.1.4 锂电池负极材料业务
6.1.5 在华布局
6.1.6 核心竞争力
6.1.7 经营数据
6.2 三菱化学株式会社
6.2.1 基本介绍
6.2.2 发展历程及展望
6.2.3 生产基地
6.2.4 锂电池负极材料业务
6.2.5 在华布局
6.2.6 核心竞争力
6.2.7 经营数据
6.3 日本碳素
6.3.1 基本介绍
6.3.2 发展历程
6.3.3 生产基地
6.3.4 经营数据
6.4 JFE化学
6.5 日本吴羽
6.5.1 基本介绍
6.5.2 生产基地
6.5.3 锂电池负极材料业务
6.5.4 在华布局
6.5.5 核心竞争力
6.5.6 经营数据
第七章 中国负极材料重点企业
7.1 深圳市贝特瑞新能源材料股份有限公司
7.1.1 基本介绍
7.1.2 产业布局
7.1.3 发展历程及展望
7.1.4 产品、技术及解决方案
7.1.5 客户配套
7.1.6 产品产销
7.1.7 核心竞争力
7.1.8 经营数据
7.2 上海杉杉科技有限公司
7.2.1 基本介绍
7.2.2 关联公司
7.2.3 发展历程及展望
7.2.4 产品、技术及解决方案
7.2.5 客户配套
7.2.6 产品产销
7.2.7 核心竞争力
7.2.8 经营数据
7.3 湖南星城石墨科技股份有限公司
7.3.1 基本介绍
7.3.2 发展历程及展望
7.3.3 产品、技术及解决方案
7.3.4 客户配套
7.3.5 供应体系
7.3.6 产品产销
7.3.7 核心竞争力
7.3.8 经营数据
7.4 湖州创亚动力电池有限公司
7.4.1 基本介绍
7.4.2 产品、技术及解决方案
7.4.3 客户配套
7.4.4 产品产销
7.4.5 经营数据
7.5 江西正拓
7.5.1基本介绍
7.5.2 发展历程及展望
7.5.3 产品、技术及解决方案
7.5.4 客户配套
7.5.5 供应体系
7.5.6 产品产销
7.5.7 经营数据
7.6 其他企业
7.6.1 江西紫宸
7.6.2 深圳斯诺
7.6.3 摩根海容
7.6.6 大连宏光
7.6.5 天津锦美
第八章 钛酸锂材料重点企业
8.1 石原产业株式会社
8.1.1 基本介绍
8.1.2 发展历程及展望
8.1.3 生产基地
8.1.4 钛酸锂材料业务
8.1.5 经营数据
8.2 成都兴能新材料股份有限公司
8.2.1 基本介绍
8.2.2 附属公司
8.2.3 钛酸锂材料业务
8.3 北方奥钛纳米技术有限公司
8.3.1 基本介绍
8.3.2 发展历程及展望
8.3.3 关联公司
8.3.4 钛酸锂材料业务
1 Overview of Lithium Battery Anode Materials
1.1 Definition
1.2 Industry Chain
2 Lithium Battery Anode Materials Market
2.1 Market Size
2.2 Competitive Pattern
2.3 New Anode Materials
2.3.1 Lithium Titanate
2.3.2 Hard/Soft Carbon
2.3.3 Silicon-based Composites
2.3.4 Graphene
3 Chinese Lithium Battery Anode Materials Market
3.1 Industrial Policy
3.2 Market Size
3.3 Competitive Pattern
3.4 Price Trend
4 Upstream Raw Materials Market
4.1 Graphite
4.1.1 Global
4.1.2 China
4.2 Silicon Carbide
4.2.1 Global
4.2.2 China
4.3 Lithium Titanate
4.3.1 Global
4.3.2 China
4.4 Graphene
4.5 Hard/Soft Carbon
4.6 MCMB
5 Downstream Lithium Battery Market
5.1 Market Size
5.1.1 Global
5.1.2 China
5.2 Market Structure
5.2.1 Global
5.2.2 China
5.3 Competitive Pattern
5.3.1 Global
5.3.2 China
5.4 Demand
5.4.1 Consumer Electronics (3C)
5.4.2 EV
5.4.3 Industrial Energy Storage
6 Major Global Anode Materials Companies
6.1 Hitachi Chemical
6.1.1 Profile
6.1.2 Development History and Outlook
6.1.3 Production Base
6.1.4 Lithium Battery Anode Materials Business
6.1.5 Presence in China
6.1.6 Core Competence
6.1.7 Operating Data
6.2 Mitsubishi Chemical
6.2.1 Profile
6.2.2 Development History and Outlook
6.2.3 Production Base
6.2.4 Lithium Battery Anode Materials Business
6.2.5 Presence in China
6.2.6 Core Competence
6.2.7 Operating Data
6.3 Nippon Carbon
6.3.1 Profile
6.3.2 Development History
6.3.3 Production Base
6.3.4 Operating Data
6.4 JFE Chemical
6.5 Kureha
6.5.1 Profile
6.5.2 Production Base
6.5.3 Lithium Battery Anode Materials Business
6.5.4 Presence in China
6.5.5 Core Competence
6.5.6 Operating Data
7 Key Chinese Anode Materials Companies
7.1 Shenzhen BTR New Energy Materials
7.1.1 Profile
7.1.2 Industrial Layout
7.1.3 Development History and Outlook
7.1.4 Products, Technologies and Solutions
7.1.5 Customers
7.1.6 Production and Marketing of Products
7.1.7 Core Competence
7.1.8 Operating Data
7.2 Shanghai Shanshan Tech
7.2.1 Profile
7.2.2 Affiliated Companies
7.2.3 Development History and Outlook
7.2.4 Products, Technologies and Solutions
7.2.5 Customers
7.2.6 Production and Marketing of Products
7.2.7 Core Competence
7.2.8 Operating Data
7.3 Hunan Shinzoom Technology
7.3.1 Profile
7.3.2 Development History and Outlook
7.3.3 Products, Technologies and Solutions
7.3.4 Customers
7.3.5 Supply System
7.3.6 Production and Marketing of Products
7.3.7 Core Competence
7.3.8 Operating Data
7.4 HuzhouChuangya Power Battery Materials
7.4.1 Profile
7.4.2 Products, Technologies and Solutions
7.4.3 Customers
7.4.4 Production and Marketing of Products
7.4.5 Operating Data
7.5 Jiangxi Zhengtuo New Energy Sc. & Tech.
7.5.1 Profile
7.5.2 Development History and Outlook
7.5.3 Products, Technologies and Solutions
7.5.4 Customers
7.5.5 Supply System
7.5.6 Production and Marketing of Products
7.5.7 Operating Data
7.6 Other
7.6.1 Jiangxi Zichen Technology
7.6.2 Shenzhen Sinuo Industrial Development
7.6.3 Morgan AM&T Hairong
7.6.4 Dalian Hongguang Lithium
7.6.5 Tianjin Kimwan Carbon Technology and Development
8 Key Lithium Titanate Companies
8.1 ISK (Ishihara Sangyo Kaisha, Ltd)
8.1.1 Profile
8.1.2 Development History and Outlook
8.1.3 Production Base
8.1.4 Lithium Titanate Business
8.1.5 Operating Data
8.2 Chengdu Xingneng New Materials
8.2.1 Profile
8.2.2 Affiliated Companies
8.2.3 Lithium Titanate Business
8.3 Altairnano
8.3.1 Profile
8.3.2 Development History and Outlook
8.3.3 Affiliated Companies
表:锂电池的成本构成
图:锂电池负极材料分类
表:锂电池负极材料(分类别)性能对比
图:动力锂电池价值链
图:动力锂电池生产工序
图:2010-2020年全球锂电池负极材料出货量
图:2015-2020年全球负极材料产品结构
图:2015年全球负极材料企业竞争格局
图:2016年全球负极材料生产企业拟/在建产能
表:全球负极材料(分产品)主要供应商及采购商
图:商业化负极材料比电容对比
表:钛酸锂负极材料优缺点
表:硬碳/软碳主要供应商及其应用
表:Si/C负极材料电池性能对比
表:硅碳负极材料应用举例
表:2014-2018年中国锂电池负极材料出货量及石墨烯需求规模
表:中国锂电池产业相关政策
表:2015年中国锂电池负极材料性能指标要求
图:2010-2020年中国锂电池负极材料出货量
图:2010-2020年中国负极材料销量占全球总销量的比例
图:2010-2020年中国锂电池负极材料产值及增长率
表:2015年中国锂电池负极材料主要企业及其产能
表:2015年中国锂电池负极材料主要企业客户情况
图:2010-2020年中国负极材料价格走势
图:天然石墨生产流程
表:2012-2014年全球主要国家和地区天然石墨产量及储量
图:2014年全球鳞片石墨主要产区
图:2014年全球土状石墨主要产区
图:2014年全球天然石墨下游应用领域占比
表:2014年中国石墨矿石产量地区分布
图:2015年全球碳化硅产能(分地区)
表:世界碳化硅主要生产商及产能
图:2009-2015年全球碳化硅下游需求量占比
图:2015年中国主要碳化硅生产企业产能
图:2009-2015年中国碳化硅进口量及进口金额
表:2015年中国碳化硅进口量前十来源国家地区
表:2015年中国碳化硅进口量前十的省份
图:2009-2015年中国碳化硅出口量及出口金额
表:2015年中国碳化硅出口量前十国家地区
表:2015年中国碳化硅出口量前十的省份
图:2009-2015年中国碳化硅进出口均价对比
图:2015年中国黑碳化硅原块价格走势
图:2015年中国黑碳化硅段砂价格走势
图:2015年甘肃黑碳化硅段砂价格走势
表:2015年中国黑碳化硅微粉价格走势
图:2015年中国绿碳化硅原块价格走势
表:2015年中国欧洲标准绿碳化硅微粉价格走势
表:2015年中国日本标准绿碳化硅微粉价格走势
表:2015年中国钛酸锂生产企业及其产能
图:2015年全球石墨烯(分行业)需求占比
图:2012-2020年全球石墨烯市场规模
表:全球主要石墨烯制备企业
图:2004-2015年石墨烯价格
图:锂电池结构
图:2014年全球电池产品结构
图:2011-2020年全球锂电池市场需求及规模
图:2011-2020年中国锂电池销量及市场规模
图:2007-2016年中国锂电池出口量及出口额
图:2011-2015全球锂电池(分国家)销量构成
图:2013-2015年中国锂电池(分省市)销量构成
图:全球锂电池厂商梯度划分
图:2014年全球小型锂电池厂商竞争格局
表:2013-2014年全球新能源乘用车配套动力锂电池出货量及份额
图:2014年中国锂电池市场竞争格局
表:中国主要锂电池制造商
图:中国动力锂电池供应体系
表:2015H1中国新能源乘用车动力电池(分技术类型)配套量占比
图:2015年上半年主力电池厂商市场份额
图:2015年上半年主力电池厂商出货量
图:锂离子电池应用领域
图:2012-2020年全球锂电池需求结构
图:2013-2020年全球消费电子锂电池需求量及增速
图:2012-2020年全球手机销量及锂电池需求量
图:2012-2020年全球平板电脑销量及锂电池需求量
表:2013-2015年全球平板电脑市场竞争格局
图:2012-2020年全球笔记本电脑销量及锂电池需求量
图:2012-2020年全球电子烟销量及占比
图:2011-2020年全球电动乘用车(EV&PHEV)销量
图:2010-2050年全球电动汽车销量预测
表:全球主要电动汽车电池容量及续航能力
图:2011-2020年全球电动乘用车单车电池容量
图:2011-2020年全球电动乘用车动力锂电池需求
图:2011-2020年全球电动汽车动力锂电池需求(分类型)
图:2011-2020年中国电动乘用车(EV&PHEV)销量
图:2011-2020年中国电动乘用车销量占全球比重
图:2011-2020年中国动力锂电池需求(分类型)
图:2010-2016年中国动力锂电池产业规模与占比
图:2009-2016年中国移动基站数量
图:2015/2020年中国储能锂电池需求量
图:2020年中国储能锂电池(分领域)需求结构
2014-2020年储能(分应用领域)需求
表:中国储能电池制造商
表:日立化成主要发展历程
表:日立化成主要子公司分布
表:日立化成主要业务部门及其业务
表:日立化成在华布局
图:2010-2015财年日立化成营业收入及净利润
图:三菱化学全球营销网络
表:三菱化学主要发展历程
表:三菱化学主要生产基地分布
表:2015年三菱化学锂电池负极材料生产基地及产能
表:三菱化学在华主要布局
图:2008-2015财年三菱化学营业收入及营业利润
表:日本碳素主要发展历程
图:2015年日本碳素总部、生产基地及分支机构分布
图:2015年日本碳素子公司分布
图:2011-2014年日本碳素营业收入及净利润
图:2015年日本吴羽生产基地分布
图:2015年日本吴羽中国子公司及其主营业务
图:2010-2015年日本吴羽营业收入及净利润
图:贝特瑞产业布局
表:2015年贝特瑞主要子公司及其产能情况
表:贝特瑞子公司情况
表:贝特瑞主要发展历程
表:贝特瑞主要负极材料产品
图:2012-2015年贝特瑞营业收入及净利润
表:上海杉杉关联公司
表:杉杉股份负极材料发展历程
表:杉杉股份负极材料产品系列
图:2012-2015年杉杉股份负极材料业务收入及净利润
图:2012-2015年上海杉杉营业收入及净利润
表:星城石墨主要发展历程
表:星城石墨负极材料产品系列
表:2012-2013年星城石墨前五名客户贡献收入及占比
表:2012-2013年星城石墨前五名供应商采购金额及占比
图:2012-2013年星城石墨主营产品销量
图:2012-2013年星城石墨主营产品销售价格
图:2012-2015年星城石墨营业收入及净利润
图:2012-2015年星城石墨(分产品)营业收入占比
表:星城石墨负极材料产品系列
图:2012-2015年湖州创亚营业收入及净利润
表:江西正拓主要发展历程
表:江西正拓负极材料产品系列
表:2014上半年江西正拓前五名客户名称、收入贡献及占比
表:2014上半年江西正拓前五名供应商名称、采购金额及占比
图:2012-2014年江西正拓主营产品销售价格
图:2012-2015年江西正拓营业收入及净利润
图:2012-2014年江西正拓(分产品)营业收入占比
图:2012-2014年江西正拓(分地区)营业收入占比
图:2012-2014年江西正拓主营产品毛利率
表:石原产业主要发展历程
表:石原产业相关公司全球分布
图:2011-2015财年石原产业营业收入及净利润
表:兴能新材相关公司全球分布
表:奥钛主要发展历程
Cost Structure of Lithium Battery
Classification of Lithium Battery Anode Materials
Performance Comparison of Lithium Battery Anode Materials (by Category)
Value Chain of Power Lithium Battery
Production Procedures of Power Lithium Battery
Global Shipments of Lithium Battery Anode Materials, 2010-2020E
Global Anode Materials Structure, 2015-2020E
Competitive Pattern of Global Anode Materials Companies, 2015
Capacity Proposed/under Construction of Global Anode Materials Companies, 2016
Major Global Suppliers and Buyers of Anode Materials (by Product)
Specific Capacitance Comparison of Commercial Anode Materials
Merits and Demerits of Lithium Titanate Anode Material
Major Suppliers and Applications of Hard Carbon/Soft Carbon
Performance Comparison of Si/C Anode Material Batteries
Application Examples of Si/C Anode Material
China’s Shipments of Lithium Battery Anode Materials and Demand for Graphene, 2014-2018E
Policies on Lithium Battery Industry in China
Requirements on Performance Indicators of Lithium Battery Anode Materials in China, 2015
China’s Shipments of Lithium Battery Anode Materials, 2010-2020E
China’s Share of Global Anode Materials Sales, 2010-2020E
China’s Lithium Battery Anode Materials Output Value and Growth Rate, 2010-2020E
Major Lithium Battery Anode Materials Companies and Their Capacity in China, 2015
Customers of Major Lithium Battery Anode Materials Companies in China, 2015
Price Trend of Anode Materials in China, 2010-2020E
Production Process of Natural Graphite
Natural Graphite Output and Reserves, 2012-2014
Major Global Crystalline Flake Graphite Producing Areas, 2014
Major Global Amorphous Graphite Producing Areas, 2014
Shares(%) of Natural Graphite Applications Worldwide, 2014
China’s Graphite Ore Output by Region, 2014
Global SiC Capacity by Region, 2015
Major Global SiC Producers and Capacity
Global SiC Demand Structure, 2009-2015
Capacity of Major SiC Producers in China, 2015
China’s SiC Imports (Volume/Value), 2009-2015
Top10 Sources of SiC Imports in China by Import Volume, 2015
Top10 Provinces with SiC Imports in China by Import Volume, 2015
China’s SiC Exports (Volume/Value), 2009-2015
Top10 Destinations of SiC Exports from China by Export Volume, 2015
Top10 Provinces with SiC Exports in China by Export Volume, 2015
Average Import and Export Prices of SiC in China, 2009-2015
Price Trend of Black SiC Lump in China, 2015
Price Trend of Black SiC Grit Sand in China, 2015
Price Trend of Black SiC Grit Sand in Gansu, 2015
Price Trend of Black SiC Powder in China, 2015
Price Trend of Green SiC Lump in China, 2015
Price Trend of European Standard Green SiC Powder in China, 2015
Price Trend of Japanese Standard Green SiC Powder in China, 2015
Lithium Titanate Producers and Their Capacity in China, 2015
Global Graphene Demand Structure by Industry, 2015
Global Graphene Market Size, 2012-2020E
Major Global Graphene Producers
Price of Graphene, 2004-2015
Structure of Lithium Battery
Global Structure of Batteries, 2014
Global Lithium Battery Market Demand and Size, 2011-2020E
China’s Lithium Battery Sales and Market Size, 2011-2020E
China’s Lithium Battery Export Volume/Value, 2007-2016E
Global Lithium Battery Sales Structure by Country, 2011-2015
China’s Lithium Battery Sales Structure by Province, 2013-2015
Global Lithium Battery Maker Echelons
Competitive Pattern of Global Small Lithium Battery Makers, 2014
Global Shipments of Power Lithium Battery for New Energy Vehicles and Share, 2013-2014
Chinese Lithium Battery Market Competition, 2014
Major Lithium Battery Makers in China
Power Lithium Battery Supply System in China
Structure of Power Battery for New Energy Passenger Vehicles by Type of Technology, 2015H1
Market Share of Major Battery Makers, 2015H1
Shipments of Major Battery Makers, 2015H1
Applications of Lithium-ion Battery
Global Lithium Battery Demand Structure, 2012-2020E
Global Demand for Lithium Battery from Consumer Electronics and Growth Rate, 2013-2020E
Global Mobile Phone Sales Volume and Demand for Lithium Battery, 2012-2020E
Global Tablet PC Sales Volume and Demand for Lithium Battery, 2012-2020E
Competitive Landscape in Global Tablet PC market, 2013-2015
Global Sales Volume of Notebook Computers and Demand for Lithium Battery, 2012-2020E
Global Sales Volume of Electronic Cigarettes and Share, 2012-2020E
Sales Volume of Electric Passenger Cars (EV&PHEV) Worldwide, 2011-2020E
Sales Volume of Electric Vehicles Worldwide, 2010-2050E
Battery Capacity and Endurance of Global Major EV Brands
Single-vehicle Battery Capacity of Electric Passenger Cars Worldwide, 2011-2020E
Demand for Power Lithium Battery from Electric Passenger Cars Worldwide, 2011-2020E
Global Demand for Power Lithium Battery (by Type) for Electric Vehicle, 2011-2020E
Sales Volume of Electric Passenger Cars (EV & PHEV) in China, 2011-2020E
China’s Share of Global Electric Passenger Cars Sales, 2011-2020E
Demand for Power Lithium Battery (by Type) in China, 2011-2020E
Power Lithium Battery Industry Scale and Share (%) in China, 2010-2016
Quantity of Mobile Base Stations in China, 2009-2016
Demand for Energy Storage Lithium Battery in China, 2015/2020
Structure of Demand for Energy Storage Lithium Battery (by Field) in China, 2020
Demand for Energy Storage (by Application), 2014-2020E
Energy Storage Battery Manufacturers in China
Development Course of Hitachi Chemical
Distribution of Hitachi Chemical’s Subsidiaries
Business Segments and Operations of Hitachi Chemical
Presence of Hitachi Chemical in China
Revenue and Net Income of Hitachi Chemical, FY2010-FY2015
Global Marketing Network of Mitsubishi Chemical
Development Course of Mitsubishi Chemical
Distribution of Major Production Bases of Mitsubishi Chemical
Lithium Battery Anode Materials Production Bases and Capacity of Mitsubishi Chemical, 2015
Presence of Mitsubishi Chemical in China
Revenue and Operating Income of Mitsubishi, FY2008-FY2015
Development Course of Nippon Carbon
Headquarters, Production Bases and Branches of Nippon Carbon, 2015
Distribution of Nippon Carbon’s Subsidiaries, 2015
Revenue and Net Income of Nippon Carbon, 2011-2014
Distribution of Kureha’s Production Bases, 2015
Kureha’s Subsidiaries and Key Operations in China, 2015
Revenue and Net Income of Kureha, 2010-2015
Industrial Layout of Shenzhen BTR New Energy Materials
Main Subsidiaries and Capacities of Shenzhen BTR New Energy Materials, 2015
Subsidiaries of Shenzhen BTR New Energy Materials
Development Course of Shenzhen BTR New Energy Materials
Major Anode Material Products of Shenzhen BTR New Energy Materials
Revenue and Net Income of Shenzhen BTR New Energy Materials, 2012-2015
Affiliated Companies of Shanghai Shanshan Tech
History of Ningbo Shanshan’s Anode Material Development
Anode Material Product Series of Ningbo Shanshan
Ningbo Shanshan’s Revenue and Net Income from Anode Materials, 2012-2015
Revenue and Net Income of Shanghai Shanshan Tech, 2012-2015
Development Course of Hunan Shinzoom Technology
Anode Material Product Series of Hunan Shinzoom Technology
Hunan Shinzoom Technology’s Revenue from Top 5 Clients and % of Total Revenue, 2012-2013
Hunan Shinzoom Technology’s Procurement from Top Suppliers and % of Total Procurement, 2012-2013
Sales Volume of Main Products of Hunan Shinzoom Technology, 2012-2013
Selling Prices of Main Products of Hunan Shinzoom Technology, 2012-2013
Revenue and Net Income of Hunan Shinzoom Technology, 2012-2015
Revenue Structure (by Products) of Hunan Shinzoom Technology, 2012-2015
Anode Material Product Series of Hunan Shinzoom Technology
Revenue and Net Income of HuzhouChuangya Power Battery Materials, 2012-2015
Development Course of Jiangxi Zhengtuo New Energy Sc. & Tech.
Anode Material Product Series of Jiangxi Zhengtuo New Energy Sc. & Tech.
Name List and Revenue Contribution of Jiangxi Zhengtuo New Energy Sc. & Tech.’s Top 5 Clients, 2014H1
Name List and Procurement Contribution of Jiangxi Zhengtuo New Energy Sc. & Tech.’s Top 5 Suppliers, 2014H1
Selling Prices of Main Products of Jiangxi Zhengtuo New Energy Sc. & Tech., 2012-2014
Revenue and Net Income of Jiangxi Zhengtuo New Energy Sc. & Tech., 2012-2015
Revenue Structure (by Products) of Jiangxi Zhengtuo New Energy Sc. & Tech., 2012-2014
Revenue Structure (by Regions) of Jiangxi Zhengtuo New Energy Sc. & Tech., 2012-2014
Gross Margins of Main Products of Jiangxi Zhengtuo New Energy Sc. & Tech., 2012-2014
Development Course of ISK
Distribution of ISK’s Associated Companies Worldwide
Revenue and Net Income of ISK, FY2011-FY2015
Distribution of Associated Companies of Chengdu Xingneng New Materials Worldwide
Development Course of Altairnano
如果这份报告不能满足您的要求,我们还可以为您定制报告,请 留言说明您的详细需求。
|