|
|
|
报告导航:研究报告—
金融与服务业—金融业
|
|
2016-2020年中国自动柜员机(ATM)行业研究报告 |
 |
字数:3.7万 |
页数:204 |
图表数:202 |
|
中文电子版:9000元 |
中文纸版:4500元 |
中文(电子+纸)版:9500元 |
|
英文电子版:2400美元 |
英文纸版:2600美元 |
英文(电子+纸)版:2700美元 |
|
编号:ZJF084
|
发布日期:2016-03 |
附件:下载 |
 |
|
|
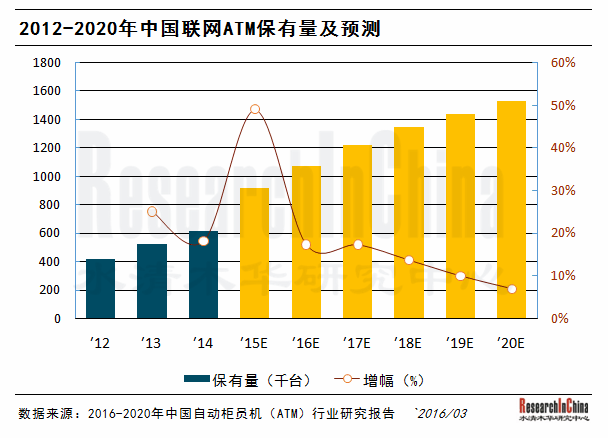
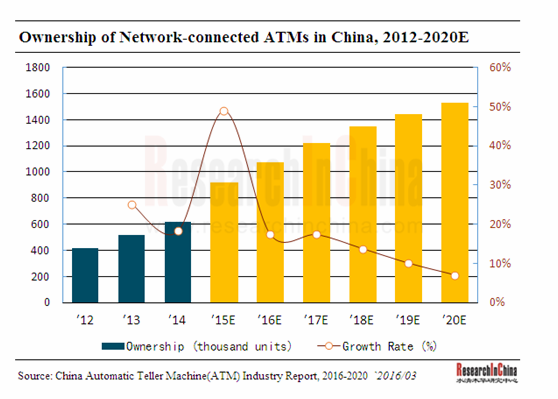
自1985年第一台ATM在中国布放以来,ATM安装总量每年保持两位数增长。截至到2015年9月末,中国联网ATM数量达到84.08万台,同比增长达44.1%,2007-2015年年均复合增长27.2%。预计2015年末将超过90万台,2020年将突破150万台。
从市场发展来看,2015年中国自动柜员机(ATM)行业主要特点有:
(1)与国外相比仍有较大差距
尽管近年来中国ATM联网数量增长较快,但截至2015年末百万人口拥有量仅为626台,距发达国家的1409台(2014年北美数据)有较大差距;每台ATM对应的银行卡数量为6246张,远超过国际上每台ATM支持4000张银行卡的国际标准配置水平。因此中国ATM行业尚有较大的市场潜力待开发,尤其是农村及城市社区金融网点匮乏,对ATM的需求较大。
(2)存取款一体机成为主流机型
存取款现金自动循环功能可以最大限度地提高ATM的使用效率,已成为银行采购的主流机型。2014年各大行存取款一体机采购量达70655台,在当年新增ATM中的占比达到72.17%,较2007年翻番。
(3)VTM设备成为市场亮点
VTM设备能帮助用户实现对公对私、国际国内、本外币、金融理财等全方位金融服务,其功能的极大扩展以及较高的成本效益比,使之成为未来自助金融服务市场的亮点。目前中国各大银行已经开始陆续布放该类设备,例如截至2015年6月末交通银行已累计布放489台。
从竞争格局来看:
目前中国ATM 厂商有数十家,其中包括广电运通、深圳怡化、东方通信、御银股份、恒银金融等在内的国产品牌,NCR、迪堡、德利多富在内的欧美品牌以及日立、OKI、晓星等在内的日韩品牌。
随着中国政府对于金融信息安全越来越重视,对于信息技术自主可控的要求越来越严,本土几家拥有核心技术和知识产权的ATM品牌随之崛起,如广电运通以及御银股份等,外资ATM品牌则受到极大限制,纷纷转向和本土二线品牌合资,如Diebold与浪潮软件,OKI与神州信息都已经成立合资公司,合荣欣业与OKI、恒银与晓星、日立和中电也在密切接触,未来一段时间行业的洗牌将成为趋势。
《2016-2020年中国自动柜员机(ATM)行业研究报告》主要进行了以下研究:
 ATM行业概况(包括定义、分类、产业链、市场特点、经营模式、行业政策、技术趋势等); ATM行业概况(包括定义、分类、产业链、市场特点、经营模式、行业政策、技术趋势等);
全球ATM市场总体情况(包括市场规模、竞争格局、市场结构、发展前景等);
中国ATM市场总体情况(包括市场规模、竞争格局、进出口市场、市场结构、发展前景等);
中国ATM细分市场分析(包括CRS、VTM、ATM运营市场等);
银行卡市场分析(银行发卡量、IC卡发展状况等);
包括NCR、Diebold、Wincor Nixdorf、Hitachi、OKI以及广电运通、御银股份、东方通信、神州信息、深圳印花等在内的11家ATM生产企业分析(包括企业简介、经营业绩、营收构成、研发支出、ATM业务、发展战略等)。
Since 1985, when the first ATM was unveiled in China, the total ATM installations have showed a double-digit growth every year. As of the end of September 2015, the number of network-connected ATMs reached 840,800 units, up 44.1% year-on-year, with a CAGR of 27.2% during 2007-2015. It is projected that the figure would exceed 900,000 units by the end of 2015 and 1.5 million units by 2020.
Seen from market development, China’s ATM industry in 2015 was characterized by the following:
(1) A big gap with developed countries
Although the number of network-connected ATMs in China has increased rapidly in recent years, the ATM ownership per million people was only 626 units as of the end of 2015, hence a huge gap compared with 1,409 units (2014’s data for North America) in developed countries. The number of bank cards supported by each ATM was 6,246, far exceeding the international standard configuration of 4,000 bank cards by each ATM. In this sense, China’s ATM industry still has large market potential. This is particularly true of rural areas and urban communities, where financial outlets are so scarce that there would be a huge demand for ATMs.
(2) Cash recycling system (CRS) has become mainstream models
Cash recycling system (CRS) could maximize the use of ATM and thus has become the mainstream models when banks purchase machines. In 2014, major banks bought 70,655 units of CRS, accounting for 72.17% of the year’s added ATMs, almost doubling that in 2007.
(3) VTM has become market highlights
VTM equipment can deliver all-round financial services including public and private business, domestic and international business, domestic and foreign currency business, and wealth management. Its greatly expanded functions and higher cost-effectiveness ratio would make it a highlight in future self-service financial services market. Currently, major banks in China have begun to deploy this kind of equipment, with Bank of Communications, for example, having deployed 489 VTMs as of the end of June 2015.
From the perspective of competitive landscape:
At present, there are scores of ATM manufacturers in China, including homegrown brands like GRG Banking, Shenzhen Yihua Computer, Eastcom, KingTeller, and Cashway, European and American brands such as NCR, Diebold, and Wincor Nixdorf, and Japanese and South Korean brands like Hitachi, OKI, and Hyosung.
As the Chinese government attaches increasing importance to financial information security and poses more and more stringent requirements on independent control of information technology, some Chinese ATM brands with core technologies and intellectual property rights have sprung up, such as GRG Banking, KingTeller, etc. As a result, foreign ATM brands have been greatly restricted, and they have successively established joint ventures with second-line brands. For instance, Diebold, along with Inspur Software, and OKI, together with DCITS, have set up joint ventures. These partners such as Hiaward and OKI, Cashway and Hyosung, and Hitachi and CLP are conducting close contact. For some time to come, the industry tends to be reshuffled.
The report highlights the followings:
 Overview of ATM industry, including definition, classification, industrial chain, market characteristics, operation mode, industry policy, and technology trends, etc.; Overview of ATM industry, including definition, classification, industrial chain, market characteristics, operation mode, industry policy, and technology trends, etc.;
Overview of global ATM market, including market size, competitive landscape, market structure, and development prospects, etc.;
Overview of Chinese ATM market, including market size, competitive landscape, import and export, market structure, and development prospects, etc.;
China’s ATM market segments, including CRS, VTM, ATM operation markets, etc.;
 Bank card market, including quantity of cards issued, IC card development, etc.; Bank card market, including quantity of cards issued, IC card development, etc.;
Profile, operation, revenue structure, R&D costs, ATM business, and development strategy of 11 ATM manufacturers, including NCR, Diebold, Wincor Nixdorf, Hitachi, OKI, GRG Banking, KingTeller, Eastcom, DCITS, and Shenzhen Yihua Computer.
第一章 自动柜员机行业简介
1.1 定义和分类
1.1.1 定义
1.1.2 分类
1.2 产业链
1.3 运营模式
1.3.1 国外自动柜员机运营模式
1.3.2 中国自动柜员机运营模式
1.4 行业政策
1.5 发展趋势
1.5.1 ATM功能将进一步扩展
1.5.2 向更加安全的方向发展
1.5.3 生物识别技术应用逐渐增加
1.5.4 进一步集成无线网络技术
1.5.5 无卡取款方式将普及
第二章 全球自动柜员机市场
2.1银行IT市场
2.2 ATM市场
2.2.1 自动柜员机保有量
2.2.2 自动柜员机安装密度
2.3 竞争格局
2.3.1 区域竞争
2.3.2 企业竞争
2.4 发展前景
第三章 中国自动柜员机市场
3.1 市场现状
3.2 行业特点
3.2.1 经营模式
3.2.2 区域性
3.2.3 季节性
3.3 市场规模
3.3.1 自动柜员机保有量
3.3.2 自动柜员机安装密度
3.3.3 银行自动柜员机采购量
3.4 竞争格局
3.4.1 ATM厂商竞争
3.4.2 ATM采购机构竞争
3.5 进出口分析
3.5.1 进口
3.5.2 出口
3.6 主要驱动因素及展望
第四章 中国自动柜员机细分市场
4.1 概况
4.2 存取款一体机(CRS)
4.2.1概况
4.2.2 采购量及保有量
4.2.3 竞争格局
4.2.4 预测
4.3 远程视频银行柜员机(VTM or ITM)
4.3.1 概况
4.3.2 技术方案
4.3.3 市场价值
4.3.4 竞争格局
4.4 ATM金融服务外包
第五章 中国银行卡业务
5.1 银行卡发卡量
5.2 银行卡取现及存现
5.3 金融IC卡
5.3.1 金融IC卡概述
5.3.2 发展历程
5.3.3 市场规模
5.3.4 EVM 使用情况
第六章 中国自动柜员机主要采购商
6.1 中国农业银行
6.1.1 公司简介
6.1.2 银行卡发行量
6.1.3 自动柜员机保有量
6.2 中国工商银行
6.2.1公司简介
6.2.2 银行卡发行量
6.2.3 自动柜员机保有量
6.3 中国建设银行
6.3.1 公司简介
6.3.2 银行卡发行量
6.3.3 自动柜员机保有量
6.4 中国银行
6.4.1 公司简介
6.4.2 银行卡发行量
6.4.3 自动柜员机保有量
6.5 中国交通银行
6.5.1 公司简介
6.5.2 银行卡发行量
6.5.3 自动柜员机保有量
6.6 部分股份制商业银行
6.6.1 招商银行
6.6.2 中信银行
6.6.3 浦发银行
第七章 全球主要自动柜员机生产企业
7.1 美国NCR
7.1.1 公司简介
7.1.2 经营业绩
7.1.3 营收构成
7.1.4 毛利率
7.1.5 研发支出
7.1.6 自动柜员机业务
7.1.7 在华自动柜员机业务
7.1.8 Omni-channel 技术
7.1.9 NCR与Vidyo在iTM领域的合作
7.2 美国迪堡
7.2.1 公司简介
7.2.2 经营业绩
7.2.3 营收构成
7.2.4 毛利率
7.2.5 研发支出
7.2.6 ATM业务
7.2.7 在华ATM业务
7.2.8 战略规划
7.2.9 与wincor Nixdorf的合并
7.2.10 与浪潮合资
7.3 德国德利多富
7.3.1 公司简介
7.3.2 经营业绩
7.3.3 营收构成
7.3.4 毛利率
7.3.5 研发支出
7.3.6 ATM业务
7.3.7 在华ATM业务
7.4 日本日立
7.4.1 公司简介
7.4.2 经营业绩
7.4.3 营收构成
7.4.4 研发支出
7.4.5 ATM业务
7.4.6 战略规划
7.4.7在华ATM业务
7.5 日本冲电气(OKI)
7.5.1 公司简介
7.5.2 经营业绩
7.5.3 营收构成
7.5.4 毛利率
7.5.5 研发支出
7.5.6 ATM业务
7.5.7 在华ATM业务
7.5.8 战略规划
7.5.9 与神州信息合资
第八章 中国主要自动柜员机生产企业
8.1 广电运通
8.1.1 公司简介
8.1.2 经营业绩
8.1.3 营收构成
8.1.4 毛利率
8.1.5 研发支出
8.1.6 订单情况
8.1.7 自动柜员机业务
8.1.8 全国金融外包服务平台建设情况
8.1.9 发展前景
8.2 深圳怡化电脑
8.2.1 公司简介
8.2.2 生产及销售情况
8.2.3 主要客户
8.2.4 自动柜员机业务
8.2.5 最新技术成果
8.2.6 怡化未来的技术趋势
8.3 东方通信
8.3.1 公司简介
8.3.2 经营业绩
8.3.3 营收构成
8.3.4 毛利率
8.3.5 研发支出
8.3.6 自动柜员机业务
8.3.7 发展前景
8.4 御银股份
8.4.1 公司简介
8.4.2 经营业绩
8.4.3 营收构成
8.4.4 毛利率
8.4.5 研发支出
8.4.6 前五大客户
8.4.7 自动柜员机业务
8.4.8 发展前景
8.4.9 御银增资ATM生产子公司
8.5 恒银金融
8.5.1 公司简介
8.5.2 自动柜员机业务
8.5.3 金融服务外包业务
8.5.4 股份制改造及上市辅导
8.6 神州信息
8.6.1 公司简介
8.6.2 经营业绩
8.6.3 营收构成
8.6.4 毛利率
8.6.5 研发支出
8.6.6 ATM主要产品及解决方案
8.6.7 广电运通间接控制神州信息
8.6.8发展前景
1. Overview of ATM
1.1 Definition and Classification
1.1.1 Definition
1.1.2 Classification
1.2 Industry Chain
1.3 Operating Mode
1.3.1 Operation Mode of Foreign ATM Markets
1.3.2 Operation Mode of Chinese ATM Market
1.4 Industry Policy
1.5 Development Trend
1.5.1 Further-expanded Function of ATM
1.5.2 Developing toward Safer Direction
1.5.3 Wider Application of Biological Recognition Technology
1.5.4 Further Integration of Wireless Network Technology
1.5.5 Popularization of No-card Withdrawal
2. Global ATM Market
2.1 Banking IT Market
2.2 ATM Market
2.2.1 Quantity of ATM
2.2.2 ATM Installation Rate
2.3 Competition Pattern
2.3.1 Regional Competition
2.3.2 Corporate Competition
2.4 Development Outlook
3. Chinese ATM Market
3.1 Status Quo
3.2 Industrial Characteristics
3.2.1 Business Model
3.2.2 Regionality
3.2.3 Seasonality
3.3 Market Size
3.3.1 Quantity of ATM
3.3.2 ATM Installation Rate
3.3.3 ATM Purchase Volume of Banks
3.4 Competition Pattern
3.4.1 Manufacturers
3.4.2 Competition between ATM Buyers
3.5 Imports & Exports
3.5.1 Imports
3.5.2 Exports
3.6 Key Drivers and Prospect
4. Key Market Segments
4.1 Overview
4.2 CRS
4.2.1 Overview
4.2.2 Purchase Quantity and Ownership
4.2.3 Competitive Landscape
4.2.4 Forecast
4.3 Video Teller Machine (VTM or ITM)
4.3.1 Overview
4.3.2 Technical Proposal
4.3.3 Market Value
4.3.4 Competitive Landscape
4.4 ATM Outsourcing
5. Bank Card Business in China
5.1 Number of Issued Bank Cards
5.2 Withdrawal and Deposit
5.3 Financial IC Cards
5.3.1 Overview
5.3.2 Development Course
5.3.3 Market Size
5.3.4 EVM Deployment
6. Major ATM Clients in China
6.1 Agricultural Bank of China
6.1.1 Profile
6.1.2 Number of Issued Bank Cards
6.1.3 Quantity of ATM
6.2 Industrial and Commercial Bank of China
6.2.1 Profile
6.2.2 Number of Issued Bank Cards
6.2.3 Quantity of ATM
6.3 China Construction Bank
6.3.1 Profile
6.3.2 Number of Issued Bank Cards
6.3.3 Quantity of ATM
6.4 Bank of China
6.4.1 Profile
6.4.2 Number of Issued Bank Cards
6.4.3 Quantity of ATM
6.5 Bank of Communications
6.5.1 Profile
6.5.2 Number of Issued Bank Cards
6.5.3 Quantity of ATM
6.6 Some Joint-stock Commercial Banks
6.6.1 China Merchants Bank
6.6.2 China CITIC Bank
6.6.3 Shanghai Pudong Development Bank
7. Global Major ATM Manufacturers
7.1 NCR
7.1.1 Profile
7.1.2 Operating Performance
7.1.3 Revenue Structure
7.1.4 Gross Margin
7.1.5 R & D Expenditure
7.1.6 ATM Business
7.1.7 ATM Business in China
7.1.8 Omni-channel Technology
7.1.9 Cooperation in iTM between NCR and Vidyo
7.2 Diebold
7.2.1 Profile
7.2.2 Operating Performance
7.2.3 Revenue Structure
7.2.4 Gross Margin
7.2.5 R & D Expenditure
7.2.6 ATM Business
7.2.7 ATM Business in China
7.2.8 Strategic Planning
7.2.9 Merger with Wincor Nixdorf
7.2.10 Forming New Joint Venture with Inspur
7.3 Wincor Nixdorf
7.3.1 Profile
7.3.2 Operating Performance
7.3.3 Revenue Structure
7.3.4 Gross Margin
7.3.5 R & D Expenditure
7.3.6 ATM Business
7.3.7 ATM Business in China
7.4 Hitachi
7.4.1 Profile
7.4.2 Operating Performance
7.4.3 Revenue Structure
7.4.4 R & D Expenditure
7.4.5 ATM Business
7.4.6 Strategic Planning
7.4.7 ATM Business in China
7.5 OKI
7.5.1 Profile
7.5.2 Operating Performance
7.5.3 Revenue Structure
7.5.4 Gross Margin
7.5.5 R & D Expenditure
7.5.6 ATM Business
7.5.7 ATM Business in China
7.5.8 Strategic Planning
7.5.9 Forming Joint Venture with DCITS
8. Major Chinese ATM Manufacturers
8.1 GRG Banking
8.1.1 Profile
8.1.2 Operating Performance
8.1.3 Revenue Structure
8.1.4 Gross Margin
8.1.5 R & D Expenditure
8.1.6 Orders
8.1.7 ATM Business
8.1.8Construction of Financial Outsourcing Service Platform Nationwide
8.1.9 Development Prospect
8.2 Shenzhen Yihua Computer
8.2.1 Profile
8.2.2 Production and Sales
8.2.3 Major Clients
8.2.4 ATM Business
8.2.5 Latest Technological Achievements
8.2.6 Future Technology Trends
8.3 Eastcom
8.3.1 Profile
8.3.2 Operating Performance
8.3.3 Revenue Structure
8.3.4 Gross Margin
8.3.5 R & D Expenditure
8.3.6 ATM Business
8.3.7 Development Prospect
8.4 KingTeller
8.4.1 Profile
8.4.2 Operating Performance
8.4.3 Revenue Structure
8.4.4 Gross Margin
8.4.5 R & D Expenditure
8.4.7 ATM Business
8.4.8 Development Prospect
8.4.9 KingTeller Increases Capital to ATM Production Subsidiaries
8.5 Cashway
8.5.1 Profile
8.5.2 ATM Business
8.5.3 Financial Service Outsourcing Business
8.5.4 Shareholding Reform and Pre-listing Tutoring
8.6 DCITS
8.6.1 Profile
8.6.2 Operating Performance
8.6.3 Revenue Structure
8.6.4 Gross Margin
8.6.5 R & D Expenditure
8.6.6 ATM Main Products and Solutions
8.6.7 GRGBanking Indirectly Controls DCITS
8.6.8 Development Prospect
图:中国ATM合作运营盈利模式
图:中国ATM融资租赁盈利模式
图:部分厂商和机构近期推出的具备生物识别功能的ATM
图:2014-2018年全球金融行业信息化支出(EUR bn)
图:2007-2015年全球ATM保有量及同比增长
图:2007-2015年全球新增ATM数量及同比增长
图:2007-2015年全球每百人ATM保有量及同比增长
图:2010-2015年全球ATM保有量市场份额(分区域)
图:2007-2015年全球及中国ATM保有量及中国占比
图:2015年全球ATM企业市场份额(以保有量计)
图:2015-2020年全球ATM保有量(百万台)
图:2007-2015年中国加入银联网络的ATM保有量(千台)
图:2007-2015年中国每百万人ATM保有量
图:2007-2015年中国每台ATM对应银行卡数量
图:2007-2014年中国(银行)ATM采购量及同比增长
图:2007-2014年中国(银行)存取款一体机(CRS)采购量及同比增长
图:2007-2014年中国(银行)存取款一体机(CRS)市场份额(按采购量)
图:2007-2014年中国ATM市场国内外生产商销量
图:2007-2014年中国ATM市场生产商份额(按销量)
图:2013-2014年中国主要银行ATM采购量份额排名
图:2010-2015年中国ATM进口量及同比增长
图:2010-2015年中国ATM进口额及同比增长
图:2010-2015年中国ATM进口平均单价及同比增长
图:2010-2015年中国ATM出口量及同比增长
图:2010-2015年中国ATM出口额及同比增长
图:2010-2015年中国ATM出口平均单价及同比增长
图:2014-2020年中国联网ATM数量预测
图:2007-2015年中国存取款一体机保有量及同比增长
图:2007-2015年中国存取款一体机市场份额(按保有量)
图:2010-2015年中国存取款一体机(CRS)市场企业市场份额(按销量)
图:2006-2020年中国存取款一体机采购量及同比增长
图:2015-2020年中国存取款一体机保有量及同比增长
图:2015-2020年中国存取款一体机市场份额(按保有量)
图:VTM产业链及主要竞争企业
图:ATM外包服务示意图
图:2007-2015年中国银行卡累计发行量及同比增长
图:2007-2015年中国银行卡发卡量构成
图:2011-2015年中国银行卡取现交易量及同比增长
图:2011-2015年中国银行卡取现交易额及同比增长
图:2011-2015年中国银行卡存现交易量及同比增长
图:2011-2015年中国银行卡存现交易额及同比增长
图:2011-2015年中国银行卡取现及存现每笔交易平均交易额
图:2010-2015年中国金融IC卡累计发行量、同比增长及其在银行卡中渗透率
图:2014-2015年世界主要地区EMV推进进程
图:Visa的EMV ATM改造推进计划
图:2007-2015年中国农业银行银行卡累计发行量及同比增长
图:2007-2015年中国农业银行借记卡及信用卡累计发行量
图:2007-2015年中国农业银行借记卡及信用卡累计发行量份额
图:2007-2015年中国农业银行ATM保有量及同比增长
图:2007-2015年中国农业银行ATM保有量市场份额
图:2007-2015年中国农业银行每台ATM对应银行卡数量
图:2007-2015年中国工商银行银行卡累计发行量及同比增长
图:2007-2015年中国工商银行借记卡及信用卡累计发行量
图:2007-2015年中国工商银行借记卡及信用卡市场份额(按累计发行量)
图:2007-2015年中国工商银行ATM保有量及同比增长
图:2007-2015年中国工商银行ATM保有量市场份额
图:2007-2015年中国工商银行ATM交易额及同比增长
图:2007-2015年中国工商银行每台ATM对应银行卡数量
图:2007-2015年中国建设银行银行卡累计发行量及同比增长
图:2007-2015年中国建设银行借记卡及信用卡累计发行量
图:2007-2015年中国建设银行借记卡及信用卡累计发行量份额
图:2007-2015年中国建设银行ATM保有量及同比增长
图:2007-2015年中国建设银行ATM保有量市场份额
图:2007-2015年中国建设银行每台ATM对应银行卡数量
图:2007-2015年中国银行银行卡累计发行量及同比增长
图:2007-2015年中国银行借记卡及信用卡累计发行量
图:2007-2015年中国银行借记卡及信用卡累计发行量份额
图:2008-2015年中国银行ATM保有量及同比增长
图:2008-2015年中国银行ATM保有量市场份额
图:2008-20145年中国银行每台ATM对应银行卡数量及同比增长
图:2011-2015年中国交通银行借记卡、信用卡累计发行量
图:2011-2015年中国交通银行借记卡、信用卡累计发行量份额
图:2007-2015年中国交通银行ATM保有量及同比增长
图:2007-2015年中国交通银行ATM保有量市场份额
图:2011-2015年中国交通银行每台ATM对应银行卡数量
图:2013-2015年交通银行iTM设备安装量
图:2010-2015年中国招商银行ATM保有量及同比增长
图:2010-2015年招商银行存取款一体机和自动取款机安装量
图:2010-2015年中国招商银行ATM保有量市场份额
图:2007-2015年中国中信银行ATM保有量及同比增长
图:2007-2015年中国中信银行ATM保有量市场份额
图:2009-2015年中国浦发银行ATM保有量及同比增长
图:2009-2015年中国浦发银行ATM保有量市场份额
图:2009-2015年NCR营业收入及净利润
图:2016-2020年NCR营业收入及净利润
表:2010-2015年NCR营收构成(分业务)
表:2010-2015年NCR营收构成(分区域)
图:2009-2014年NCR毛利及同比增长
图:2009-2015年NCR研发支出及同比增长
图:NCR ATM全球生产基地分布
表:NCR主要ATM产品
图:2007-2014年NCR ATM在中国销量及市场份额
图:NCR Omni-channel 平台
图:NCR收入增长机会
图:2009-2015年Diebod营业收入及净利润
图:2016-2020年Diebod营业收入及净利润
表:2009-2014年Diebod营收构成(分业务)
表:2009-2015年Diebod营收构成(分区域)
图:2009-2015年Diebod毛利及同比增长
图:2009-2015年Diebod研发支出及同比增长
图:2007-2014年Diebold ATM在中国销量及 市场份额
图:2014-2018年Diebold战略规划
图:Diebold和Wincor Nixdorf合并的对价关系
图:Diebold和Wincor Nixdorf合并后各区域的市场份额
图:浪潮迪堡合资架构
图:2009-2015财年Wincor Nixdorf营业收入及同比增长
图:2016-2020财年Wincor Nixdorf营业收入及净利润
图:2009-2015财年Wincor Nixdorf 营收构成(分部门)
图:2009-2015财年Wincor Nixdorf 营收构成(分业务)
图:2009-2015财年Wincor Nixdorf营收构成(分区域)
图:2009-2015财年Wincor Nixdorf毛利及同比增长
图:2009-2015财年Wincor Nixdorf研发支出及同比增长
图:2007-2014年Wincor Nixdorf ATM在中国销量及市场份额
图:2009-2015财年 Hitachi营业收入及利润
图:2015-2020财年 Hitachi营业收入及利润
图:2013-2015财年Hitachi营收构成(分业务)
图:2013-2015财年Hitachi营收构成(分区域)
图:2009-2015财年Hitachi研发支出及同比增长
图:2013-2015财年Hitachi研发支出(分业务)
图: Hitachi-Omron营收数据
图:Information & Telecommunication Systems战略
图:2007-2014年Hitachi ATM在中国销量及市场份额
图:2014-2018财年Hitachi营业收入及同比增长
图:2009-2015财年OKI营业收入及同比增长
图:2016-2020财年OKI营业收入及净利润
图:2009-2015财年OKI营收构成(分业务)
图:2009-2015财年OKI毛利及同比增长
图:2009-2014财年OKI研发支出及同比增长
图:OKI海外ATM业务布局
图:OKI ATM业务发展历史
图:2008-2014年OKI ATM在中国销量及市场份额
图:2014-2018财年OKI营业收入及同比增长
图:OKI战略
图:2009-2015年广电运通营业收入及同比增长
图:2009-2015年广电运通净利润及同比增长
图:2009-2015年广电运通营收构成(分业务)
图:2009-2015年广电运通营收构成(分区域)
图:2009-2015年广电运通毛利率(分业务)
图:2009-2015年广电运通毛利率(分区域)
图:2009-2015年广电运通研发支出及同比增长
图:2013-2014年主要产品及服务订单情况(RMB mln)
图:2015-2020年广电运通营业收入及同比增长
图:2007-2013年广电运通ATM在中国市场销量及市场份额
图:怡化电脑人脸识别技术部分应用示意图
图:2009-2015年东方通信营业收入及同比增长
图:2009-2015年东方通信净利润及同比增长
图:2009-2015年东方通信营收构成(分业务)
图:2009-2015年东方通信毛利率(分业务)
图:2009-2015年东方通信研发支出、同比增长及其占营业收入比例
图:2009-2018年东方通信ATM收入及同比增长
图:2015-2020年东方通信营业收入及同比增长
图:2009-2015年御银股份营业收入及同比增长
图:2009-2015年御银股份净利润及同比增长
图:2009-2014年御银股份营收构成(分业务)
图:2009-2015年御银股份营收构成(分区域)
表:2009-2015年御银股份毛利率(分业务)
图:2010-2015年御银股份毛利率(分区域)
图:2009-2015年御银股份研发支出及同比增长
图:2015-2020年御银股份营业收入及同比增长
图:2010-2018年恒银金融营业收入及同比增长
图:2011-2015年神州信息营业收入及同比增长
图:2011-2015年神州信息净利润及同比增长
图:2011-2015年神州信息营收构成(分业务)
图:2011-2015年神州信息毛利率(分业务)
图:2013-2015年神州信息研发支出及占营收比例
图:神州信息主要ATM产品
图:2015-2020年神州信息营业收入及同比增长
表:ATM分类
表:ATM上游各模块对应的主要厂商
表:中国主要ATM运营商
表:近年中国主要ATM相关领域行业政策
表:2012-2015年中国ATM进口来源国家和地区及其进口量和进口额
表:2012-2015年中国ATM进口目的省市及其进口量和进口额
表:2012-2015年中国ATM出口Top10目的国家和地区及其出口量和出口额
表:2012-2015年中国ATM出口来源省市及其出口量和出口额
表:VTM主要功能示意图
表:VTM与银行其他主要服务方式优劣势对比
表:VTM与传统银行网点运营成本构成
表:典型无人银行主要技术组成
表:典型VTM主要工作流程
表:中国VTM市场规模测算表
表:2011-2015年中国金融IC卡受理环境改造和发行时间表
表:Diebod ATM产品系列
表:2015年Diebold推出的新产品-Irving & Janus
表:Wincor Nixdorf ATM产品系列
表:OKI近年在华业务进展
表:广电运通ATM产品范围
表:2007-2014年广电运通ATM在中国市场销量、市场份额、排名、平均单价
表:2009-2015年广电运通ATM产品及相关业务收入、毛利及毛利率
表:2015年广电运通募资情况及拟使用方向
表:广电运通金融外包服务平台示意图
表:金融外包服务平台在广电运通战略中的地位
表:广电运通金融外包服务区域布局
表:深圳怡化电脑主要客户
表:2009-2015年东方通信营收构成(分区域)
表:2011-2014年东方通信ATM销量、市场份额、排名、平均单价
表:御银股份主要ATM产品
表:2011-2014年御银股份ATM销量、市场份额、排名、平均单价
表:恒银金融主要ATM产品
表:2012-2014年恒银金融ATM销量、市场份额、排名
表:2014年1-12月恒银金融ATM中标情况
Profit Model of ATM Collaboration Operation in China
Profit Model of ATM Finance Lease in China
ATM with the Function of Biological Recognition Released Recently by Some Manufacturers and Institutions
Global Spending on Financial Industry Informatization, 2014-2018E
Global ATM Quantity and YoY Growth, 2007-2015
Global New ATM Quantity and YoY Growth, 2007-2015
Global ATM Quantity per 1 Million Persons and YoY Growth, 2007-2015
Global ATM Ownership by Region, 2010-2015
Global and China ATM Ownership and China’s Market Share, 2007-2015
Market Share of Global ATM Enterprises by Ownership, 2015
Global ATM Ownership, 2015-2020E
Quantity of ATM Connected with China UnionPay and YoY Growth, 2007-2015
ATM Quantity per 1 Million Persons in China, 2007-2015
Number of Bank Cards that Each Set of ATM Can Deal with in China, 2007-2015
ATM Purchase Volume and YoY Growth in China, 2007-2014
Purchase Volume of Cash Recycling System (CRS) and YoY Growth in China, 2007-2014
Penetration Rate of Cash Recycling System (CRS) in China (by Purchase Volume), 2007-2014
Sales Volume of Domestic and Foreign Producers in Chinese ATM Market, 2007-2014
Market Share of ATM Manufacturers in China (by Sales Volume), 2007-2014
Ranking of Major Banks in China by ATM Purchase Volume Percentage, 2013-2014
ATM Import Volume and YoY Growth in China, 2010-2015
ATM Import Value and YoY Growth in China, 2010-2015
Average Unit Price and YoY Growth of Imported ATMs in China, 2010-2015
ATM Export Volume and YoY Growth in China, 2010-2015
ATM Export Value and YoY Growth in China, 2010-2015
Average Unit Price and YoY Growth of China’s ATM Exports, 2010-2015
Number of Network-connected ATMs in China, 2014-2020E
CRS Ownership and YoY Growth in China, 2007-2015
CRS Market Share in China by Ownership, 2007-2015
Market Share of CRS Manufacturers in China by Sales Volume, 2010-2015
CRS Purchase Quantity and YoY Growth in China, 2006-2020E
CRS Ownership and YoY Growth in China, 2015-2020E
CRS Market Share in China by Ownership, 2015-2020E
VTM Industry Chain and Major Competitors
Schematic Diagram for ATM Outsourcing Service
Cumulative Volume of Issued Bank Cards and YoY Growth in China, 2007-2015
Structure of Number of Issued Bank Cards in China, 2007-2015
Withdrawal Transaction Volume and YoY Growth of Bank Cards in China, 2011-2015
Withdrawal Transaction Value and YoY Growth of Bank Cards in China, 2011-2015
Deposit Transaction Volume and YoY Growth of Bank Cards in China, 2011-2015
Deposit Transaction Value and YoY Growth of Bank Cards in China, 2011-2015
Average Transaction Value Per Withdrawal and Deposit Transaction of Bank Cards in China, 2011-2015
Cumulative Volume of Issued Financial IC Cards, YoY Growth and its Penetration in Bank Cards in China, 2010-2015
EMV Advancement Process in Major Regions around the World, 2014-2015
Visa’s EMV ATM Transformation Plan
Cumulative Volume of Issued Bank Cards and YoY Growth of Agricultural Bank of China, 2007-2015
Cumulative Volume of Issued Credit Cards and Debit Cards of Agricultural Bank of China, 2007-2015
Market Share of Agricultural Bank of China in Debit Cards and Credit Cards (by Cumulative Issued Volume), 2007-2015
ATM Quantity and YoY Growth of Agricultural Bank of China, 2007-2015
Market Share of Agricultural Bank of China by ATM Quantity, 2007-2015
Each Set of ATM Corresponding to Number of Bank Cards of Agricultural Bank of China, 2007-2015
Cumulative Volume of Issued Bank Cards and YoY Growth of Industrial and Commercial Bank of China, 2007-2015
Cumulative Volume of Issued Debit Cards and Credit Cards of Industrial and Commercial Bank of China, 2007-2015
Market Share of Industrial and Commercial Bank of China in Debit Cards and Credit Cards (by Cumulative Issued Volume), 2007-2015
ATM Quantity and YoY Growth of Industrial and Commercial Bank of China, 2007-2015
Market Share of Industrial and Commercial Bank of China by ATM Quantity, 2007-2015
ATM Transaction Value and YoY Growth of Industrial and Commercial Bank of China, 2007-2015
Each Set of ATM Corresponding to Number of Bank Cards of Industrial and Commercial Bank of China, 2007-2015
Cumulative Volume of Issued Bank Cards and YoY Growth of China Construction Bank, 2007-2015
Cumulative Volume of Issued Credit Cards and Debit Cards of China Construction Bank, 2007-2015
Market Share of China Construction Bank in Debit Cards and Credit Cards (by Cumulative Issued Volume), 2007-2014
ATM Quantity and YoY Growth of China Construction Bank, 2007-2015
Market Share of China Construction Bank by ATM Quantity, 2007-2015
Each Set of ATM Corresponding to Number of Bank Cards of China Construction Bank, 2007-2015
Cumulative Volume of Issued Bank Cards and YoY Growth of Bank of China, 2007-2015
Cumulative Volume of Issued Credit Cards and Debit Cards of Bank of China, 2007-2015
Market Share of Bank of China in Debit Cards and Credit Cards (by Cumulative Issued Volume), 2007-2015
ATM Quantity and YoY Growth of Bank of China, 2008-2015
Market Share of Bank of China by ATM Quantity, 2008-2015
Each Set of ATM Corresponding to Number of Bank Cards and YoY Growth of Bank of China, 2008-2015
Cumulative Volume of Issued Credit Cards and Debit Cards of Bank of Communications, 2011-2015
Market Share of Bank of Communications in Debit Cards and Credit Cards (by Cumulative Issued Volume), 2007-2015
ATM Quantity and YoY Growth of Bank of Communications, 2007-2015
Market Share of Bank of Communications by ATM Quantity, 2007-2015
Each Set of ATM Corresponding to Number of Bank Cards and YoY Growth of Bank of Communications, 2011-2015
iTM Equipment Installations of Bank of Communications, 2013-2015
ATM Quantity and YoY Growth of China Merchants Bank, 2010-2015
CRS and ATM Installations of China Merchants Bank, 2010-2015
Market Share of China Merchants Bank by ATM Quantity, 2010-2015
ATM Quantity and YoY Growth of China CITIC Bank, 2007-2015
Market Share of China CITIC Bank by ATM Quantity, 2007-2015
ATM Quantity and YoY Growth of Shanghai Pudong Development Bank, 2009-2015
Market Share of Shanghai Pudong Development Bank by ATM Quantity, 2009-2015
Revenue and Net Income of NCR, 2009-2015
Revenue and Net Income of NCR, 2016-2020E
NCR’s Revenue Structure (by Business), 2010-2015
NCR’s Revenue Structure (by Region), 2010-2015
Gross Profit and YoY Growth of NCR,2009-2014
R & D Expenditure and YoY Growth of NCR, 2009-2015
Global Production Base Distribution of NCR ATM
NCR’s Major ATM Products
NCR’s ATM Sales Volume and Market Share in China, 2007-2014
Omni-channel Platform of NCR
New Revenue Opportunities of NCR
Revenue and Net Income of Diebold, 2009-2015
Revenue and Net Income of Diebold, 2016-2020E
Diebold’s Revenue Structure (by Business), 2009-2014
Diebold’s Revenue Structure (by Region), 2009-2015
Gross Profit and YoY Growth of Diebold, 2009-2015
R & D Expenditure and YoY Growth of Diebold, 2009-2015
Diebold's ATM Sales Volume and Market Share in China, 2007-2014
Diebold's Strategic Planning
Diebold’s Retail Banking Evolution
Merger Consideration between Diebold and Wincor Nixdorf
Market Share of Diebold and Wincor Nixdorf (after Merger) by Region
Joint-venture Architecture of Diebold and Inspur
Revenue and YoY Growth of Wincor Nixdorf, FY2009-FY2015
Revenue and Net Income Forecast of Wincor Nixdorf, FY2016-FY2020
Revenue Structure of Wincor Nixdorf (by Segment),FY2009-FY2015
Revenue Structure of Wincor Nixdorf (by Business),FY2009-FY2015
Revenue Structure of Wincor Nixdorf (by Region), FY2009-FY2015
Gross Profit and YoY Growth of Wincor Nixdorf, FY2009-FY2015
R & D Expenditure and YoY Growth of Wincor Nixdorf, FY2009-FY2015
ATM Sales Volume and Market Share of Wincor Nixdorf in China, 2007-2014
Revenue and Income of Hitachi, FY2009-FY2015
Revenue and Net Income Forecast of Hitachi, FY2015-FY2020
Hitachi's Revenue Structure (by Business), FY2013-FY2015
Hitachi's Revenue Structure (by Region), FY2013-FY2015
R&D Costs and YoY Growth of Hitachi, FY2009-FY2015
R&D Expenses of Hitachi by Segment, FY2013-FY2015
Key Facts about Hitachi-Omron
Information & Telecommunication Systems Business strategy
Hitachi's ATM Sales Volume and Market Share in China, 2007-2014
Revenue and YoY Growth of OKI, FY2009-FY2015
Revenue and Net Income Forecast of OKI, FY2016-FY2020
OKI's Revenue Structure (by Business), FY2009-FY2015
Gross Profit and YoY Growth of OKI, FY2009-FY2015
R & D Expenditure and YoY Growth of OKI, FY2009-FY2014
OKI’s Overseas ATM Business Layout
Cash Replenishment Planning Service
Development History of OKI’s ATM Business
OKI's ATM Sales Volume and Market Share in China, 2008-2014
Strategy Chart of OKI
Revenue and YoY Growth of GRG, 2009-2015
Net Income and YoY Growth of GRG, 2009-2015
GRG’s Revenue Structure (by Product), 2009-2015
GRG’s Revenue Structure (by Region), 2009-2015
GRG’s Gross Margin (by Product), 2009-2015
GRG’s Gross Margin (by Region), 2009-2015
R & D Expenditure and YoY Growth of GRG, 2009-2015
Major Products and Service Orders of GRG, 2013-2014
Revenue and YoY Growth of GRG, 2015-2020E
ATM Sales Volume and Market Share of Shenzhen Yihua Computer in China, 2008-2014
Schematic Diagram for Yihua Computer Face Recognition Technology Applications
Revenue and YoY Growth of Eastcom,2009-2015
Net Income and YoY Growth of Eastcom,2009-2015
Eastcom’s Revenue Structure (by Product),2009-2015
Eastcom’s Gross Margin (by Product),2009-2015
Proportion of R & D Expenditure in Revenue of Eastcom,2009-2015
ATM Revenue and YoY Growth of Eastcom,2009-2018
Revenue and YoY Growth of Eastcom,2015-2020E
Revenue and YoY Growth of KingTeller,2009-2015
Net Income and YoY Growth of KingTeller,2009-2015
KingTeller’s Revenue Structure (by Business),2009-2014
KingTeller’s Revenue Structure (by Region),2009-2015
KingTeller’s Gross Margin (by Business),2009-2015
KingTeller’s Gross Margin (by Region),2010-2015
R & D Expenditure and YoY Growth of KingTeller,2009-2015
Revenue and YoY Growth of KingTeller,2015-2020E
Revenue and YoY Growth of Cashway, 2010-2018E
Revenue and YoY Growth of DCITS, 2011-2015
Net Income and YoY Growth of DCITS, 2011-2015
Revenue Structure of DCITS by Business, 2011-2015
Gross Margin of DCITS by Business, 2011-2015
R & D Expenditure and Its Ratio to Revenue of DCITS, 2013-2015
Main ATM Products of DCITS
Revenue and YoY Growth of DCITS,2015-2020E
ATM Classification
Major Manufacturers of ATM Upstream Modules
Major ATM Operators in China
Major Policies on ATM in China in Recent Years
ATM Import Origins as well as Import Volume and Value in China, 2012-2015
ATM Importing Province as well as Import Volume and Value in China, 2012-2015
China’s Top 10 ATM Export Destinations as well as Export Volume and Value, 2012-2015
China’s ATM Exporting Origins as well as Export Volume and Value, 2012-2015
Schematic Diagram for Main VTM Functions
Advantages and Disadvantages of VTM and Other Major Service Modes in Banks
Operating Cost Structure of VTM and Conventional Banking Outlets
Main Technology Composition of Typical Self-service Bank
Major Working Process for Typical VTM
Calculation Table of China’s VTM Market Size
China's Timetable for Reform of Financial IC Card Environments and Issuance, 2011-2015
Diebold ATM Product Series
Irving & Janus-New Products Released by Diebold in 2015
Diebold’s ATM Fleet in North America
Wincor Nixdorf ATM Product Series
OKI’s Business Progress in China in Recent Years
ATM Products of GRG
Sales Volume, Market Share, Ranking and Average Unit Price of GRG’s ATM in China, 2007-2014
Revenue, Gross Profit and Gross Margin of GRG’s ATM and Related Businesses, 2009-2015
Fund-raising and Proposed Usage of GRG Banking, 2015
Schematic Diagram for Financial Outsourcing Service Platform of GRG Banking
Status of Financial Outsourcing Service Platform in GRG Banking’s Strategy
Regional Distribution of GRG Banking’ sFinancial Outsourcing Service
Major Clients of Shenzhen Yihua Computer
Eastcom’s Revenue Structure (by Region), 2009-2015
ATM Sales Volume, Market Share, Ranking, Average Unit Price of Eastcom, 2011-2014
Key ATM Products of KingTeller
ATM Sales Volume, Market Share, Ranking and Average Unit Price of KingTeller, 2011-2014
Main ATM Products of Cashway
ATM Sales Volume, Market Share and Ranking of Cashway, 2012-2014
ATM Bid Winning of Cashway, Jan.-Dec.,2014
如果这份报告不能满足您的要求,我们还可以为您定制报告,请 留言说明您的详细需求。
|