|
|
|
报告导航:研究报告—
制造业—汽车
|
|
2016-2020年中国客车(大型/中型/轻型客车、客车底盘、座位客车、公交客车、校车、天然气客车、新能源客车)行业研究报告 |
 |
字数:4.4万 |
页数:136 |
图表数:175 |
|
中文电子版:8000元 |
中文纸版:4000元 |
中文(电子+纸)版:8500元 |
|
英文电子版:2300美元 |
英文纸版:2500美元 |
英文(电子+纸)版:2600美元 |
|
编号:YSJ098
|
发布日期:2016-07 |
附件:下载 |
 |
|
|
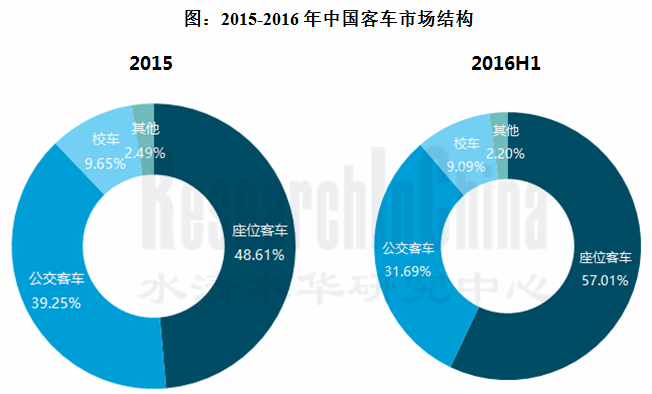
受宏观经济增长放缓、地方财政支出减少、高铁客运替代作用等多重因素影响,2015-2016年中国客车市场出现下滑。2015年中国客车(包含底盘)产、销量分别为59.09和59.54万辆,同比下降2.69%、1.90%。2016年上半年,客车产销25.57万辆和25.38万辆,同比下降9.44%和9.48%。
从各细分市场来看,呈现以下特点:
座位客车中,旅游客车和轻型座位客车增长迅速。2015-2016年,受到高铁路网建设冲击,中长途线路数量和发车班次减少,大中型座位客车增长缓慢。与此同时,受旅游市场拉动,旅游客车需求保持较快增长。轻型座位客车则受益于国家发展城乡交通一体化政策,来往于城乡之间的中短途线路需求增多,客车需求增长迅速,其中2015年增速高达40%以上。
公交客车受惠于新能源增长迅速。2015-2016年,公交客车受惠于新能源汽车拉动,市场增长明显。2016年1-5月,中国新能源客车(BEV+PHEV)产量总计25,997辆,同比增长125.65%。其中纯电动车型产量同比增幅高达225.74%,成为市场绝对主力。未来,随着公交客车新能源化趋势增强,新能源客车仍将成为客车市场的亮点。
来源:水清木华研究中心《2016-2020年中国客车(大型/中型/轻型客车、客车底盘、座位客车、公交客车、校车、天然气客车、新能源客车)行业研究报告》
企业方面,由于新能源客车需求增长,中国客车企业纷纷加大新能源客车的推广。中国最大的大中型客车生产商宇通客车,2015年共销售新能源客车20,446辆,其中纯电动客车13,885辆,插电式客车6,561。此外,2015年该公司获得中国首个燃料电池客车生产资质,未来在燃料电池客车领域有望实现领先发展。
金龙汽车虽然在新能源客车方面起步相对较晚,但旗下的“三龙”技术储备充足,竞争实力较强。2015年,公司共生产新能源客车19,435辆,销售18,434辆。其中,纯电动客车销售12,323辆,同比增长1041%;插电式客车销量6,111辆,同比增长165%。该公司新能源客车的电池系统和电机系统均为外购,主要供应商有CATL、微宏动力、精进电动等,其电控系统为自主研发设计。
水清木华研究中心《2016-2020年中国客车(大型/中型/轻型客车、客车底盘、座位客车、公交客车、校车、天然气客车、新能源客车)行业研究报告》主要包括以下内容:
 中国客车整体市场(含底盘)的市场规模、市场结构、竞争格局、进出口、发展趋势; 中国客车整体市场(含底盘)的市场规模、市场结构、竞争格局、进出口、发展趋势;
中国大、中、轻型客车市场的市场规模、市场结构、竞争格局;
中国座位客车、公交客车、校车、天然气客车等细分市场的市场规模、市场结构、发展现状;
中国新能源客车市场的市场规模、竞争格局、相关政策、技术路线、产业投资情况;
中国客车行业车联网和主动安全技术发展现状;
中国客车产业链,包括上游主要零部件(变速器、轮毂、新能源电池)供应关系和下游需求市场;
中国客车生产商发展研究,包括财务分析、客车产销量、新能源客车业务、生产能力、成本构成、发展动态等。
Affected by multiple factors like the slowdown in macro-economic growth, the slashed local fiscal expenditure and the substitution effect of high-speed rail passenger transport, Chinese bus market declined during 2015-2016. In 2015, China produced 590,900 buses (including chassis) and sold 595,400 ones, down 2.69% and 1.90% year on year respectively. In the first half of 2016, the bus output and sales volume amounted to 255,700 and 253,800 respectively, down 9.44% and 9.48% year on year correspondingly.
The market segments feature the followings:
Among seat buses, tour buses and light seat buses witness rapid growth. In 2015-2016, the construction of the high-speed railway network led to the contraction of medium and long-distance bus lines and departure frequencies as well as slow growth of medium and large seat buses. At the same time, the tourism market propelled the demand for tour buses which maintained fast growth. Thanks to the national policy on the development of urban and rural integrated transportation, the demand for medium and short-haul light seat buses commuting between urban and rural areas jumped, with the growth rate of as high above 40% in 2015.
Transit buses benefit from the fast-growing new energy. In 2015-2016, transit buses grew radically under the boost of new energy vehicles. From January to May of 2016, China's output of new energy buses (BEV + PHEV) totaled 25,997, a year-on-year surge of 125.65%. Wherein, the output of BEVs (battery electric vehicles) soared by 225.74% year on year, becoming the absolute mainstream. In the future, new energy transit buses will be the highlight of the bus market as the new energy trend becomes more obvious.
Chinese Bus Market Structure, 2015-2016
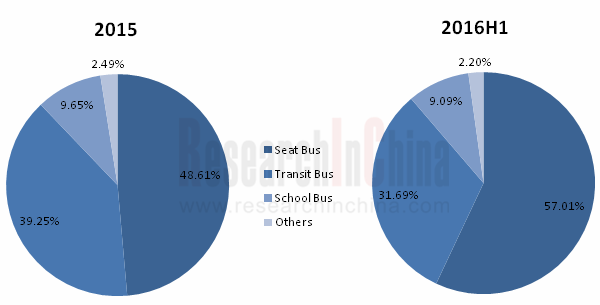
Source: ResearchInChina
The rising demand for new energy buses has stimulated Chinese bus companies to promote such buses. As the largest large and medium-sized bus manufacturer in China, Yutong Bus sold 20,446 new energy buses in 2015, including 13,885 battery electric buses and 6,561 plug-in buses. In addition, the company obtained China's first fuel cell bus production qualification in 2015, which may facilitate its leading-edge development in the field of fuel cell buses in the future.
Xiamen King Long Motor Group started relatively late in new energy buses, but its three wholly-owned subsidiaries: Higer Bus, Xiamen King Long United Automotive Industry, and Xiamen Golden Dragon Bus hold adequate technical reserves and have robust competitive strength. In 2015, Xiamen King Long Motor Group produced a total of 19,435 new energy buses, and sold 18,434 ones consisting of 12,323 battery electric buses (skyrocketing 1041% year on year) and 6,111 plug-in buses (up 165% year on year). The Group's new energy bus battery and motor systems are purchased from main suppliers such as CATL, Microvast and Jing-Jin Electric Technologies (Beijing), while its electronic control systems are the result of its independent R & D and design.
The report mainly deals with the following:
 Market size, market structure, competitive landscape, import and export, and trends of China’s overall bus market (including chassis); Market size, market structure, competitive landscape, import and export, and trends of China’s overall bus market (including chassis);
Market size, market structure, and competitive landscape of large, medium, and light bus market in China;
Market size, market structure and status quo of seat buses, transit buses, school buses, natural gas buses and other market segments in China;
Market Size, competitive landscape, related policies, technology roadmap, and industrial investment of new energy buses in China;
Telematics and active safety technology development of China bus industry;
China’s bus industry chain, including the supply relationship of main upstream spare parts (transmission, wheel hub, and new energy batteries) and downstream market demand;
Development of Chinese bus manufacturers, including their financial data, bus production and sales, new energy bus business, capacity, cost structure, latest developments, etc.
第一章 行业概述
1.1 产品简介
1.2 产品分类
1.3 相关政策
第二章 中国客车整体市场
2.1 市场规模
2.2 市场结构
2.3 竞争格局
2.3.1 市场份额
2.3.2 业绩对比
2.4 进出口
2.4.1 整体市场
2.4.2 细分市场
2.4.3 国家分布
2.5 细分市场
2.5.1 座位客车市场
2.5.2 公交车市场
2.5.3 校车市场
2.6 天然气客车
2.7 客车主动安全与车联网
2.7.1 政策及规划
2.7.2 技术标准
2.7.3 企业布局
2.8 市场发展趋势
2.8.1 技术发展趋势
2.8.2 市场发展趋势
第三章 中国客车细分市场
3.1大型客车市场
3.1.1 市场规模
3.1.2 竞争格局
3.1.3 市场结构
3.2中型客车市场
3.2.1 市场规模
3.2.2 竞争格局
3.2.3 市场结构
3.3 轻型客车市场
3.3.1 市场规模
3.3.2 竞争格局
3.3.3 市场结构
第四章 新能源客车市场
4.1 市场规模
4.2 竞争格局
4.3 产业政策
4.3.1财政补贴政策
4.3.2“削油补电”政策
4.3.3 推广考核办法
4.4 技术路线
4.5 燃料电池客车
第五章 客车产业链
5.1 上游原材料市场
5.2 关键零部件
5.2.1 变速器
5.2.2 轮毂
5.2.3 新能源电池
5.3 下游需求市场
5.3.1 客运
5.3.2 高铁
5.3.3 旅游
第六章 主要企业
6.1 宇通客车
6.1.1 企业简介
6.1.2 财务概况
6.1.3 主营构成
6.1.4 产销量
6.1.5 新能源客车
6.1.6 生产能力
6.1.7 研发费用
6.1.8 成本构成
6.1.9 零部件配套
6.1.10 发展动态
6.1.11 经营前景
6.2 金龙汽车
6.2.1 企业简介
6.2.2 财务概况
6.2.3 主营构成
6.2.4 主要子公司经营情况
6.2.5 产销量
6.2.6 新能源客车
6.2.7 生产能力
6.2.8 研发费用
6.2.9 成本构成
6.2.10 发展动态
6.2.11 经营前景
6.3 中通客车
6.3.1 企业简介
6.3.2 财务概况
6.3.3 主营构成
6.3.4 产销量
6.3.5 新能源客车
6.3.6 研发费用
6.3.7 成本构成
6.3.8 发展动态
6.3.9 经营前景
6.4 福田汽车股份有限公司
6.4.1 企业简介
6.4.2 财务概况
6.4.3 主营构成
6.4.4 产销量
6.4.5 新能源客车
6.4.6 生产能力
6.4.7 研发费用
6.4.8 经营前景
6.5 安凯客车
6.5.1 企业简介
6.5.2 财务概况
6.5.3 主营构成
6.5.4 产销量
6.5.5 新能源客车
6.5.6 生产能力
6.5.7 研发费用
6.5.8 成本构成
6.6 辽宁曙光汽车集团股份有限公司
6.6.1 企业简介
6.6.2 财务概况
6.6.3 主营构成
6.6.4 产销量
6.6.5 新能源业务
6.6.6 成本构成
6.7 扬州亚星客车股份有限公司
6.7.1 企业简介
6.7.2 财务概况
6.7.3 主营构成
6.7.4 产销量
6.7.5 新能源客车
6.7.6 研发费用
6.7.7 成本构成
6.8 比亚迪
6.8.1 企业简介
6.8.2 财务概况
6.8.3 主营构成
6.8.4 产销量
6.8.5 新能源客车
6.8.6 发展动态
6.8.7 经营前景
6.9 江淮汽车
6.9.1 企业简介
6.9.2 财务概况
6.9.3 主营构成
6.9.4 产销量
6.9.5 研发费用
6.9.6 成本构成
6.9.7 经营前景
6.10 金杯汽车
6.10.1 企业简介
6.10.2 财务概况
6.10.3 主营构成
6.10.4 产销量
6.10.5 研发费用
6.10.6 成本构成
6.10.7 经营前景
6.11 江铃汽车
6.11.1 企业简介
6.11.2 财务概况
6.11.3 主营构成
6.11.4 产销量
6.11.5 研发费用
6.11.6 经营前景
6.12 东风汽车
6.12.1 企业简介
6.12.2 财务概况
6.12.3 主营构成
6.12.4 产销量
6.12.5 研发费用
6.12.6 成本构成
6.12.7 经营前景
6.13 南京依维柯汽车有限公司
6.13.1 公司简介
6.13.2 产销量
6.13.3 发展动态
6.14 保定长安客车制造有限公司
6.14.1 公司简介
6.14.2 产销量
6.14.3 发展动态
6.14.4 经营目标
6.15 上汽大通汽车有限公司
6.15.1公司简介
6.15.2产销量
6.15.3 新能源业务
6.15.4发展动态
6.16 福建新福达汽车工业有限公司
6.16.1公司简介
6.16.2产销量
1 Industry Overview
1.1 Product Introduction
1.2 Product Classification
1.3 Policies
2 Overall Bus Market in China
2.1 Market Size
2.2 Market Structure
2.3 Competitive Landscape
2.3.1 Market Share
2.3.2 Performance Comparison
2.4 Import & Export
2.4.1 Overall Market
2.4.2 Market Segment
2.4.3 By Country
2.5 Market Segments
2.5.1 Seat Bus
2.5.2 Transit Bus
2.5.3 School Bus
2.6 Natural Gas Bus
2.7 Bus Active Safety and Telematics
2.7.1 Policy and Planning
2.7.2 Technical Standards
2.7.3 Layout of Enterprises
2.8 Market Trends
2.8.1 Technology Trends
2.8.2 Market Trends
3 Bus Market Segments in China
3.1 Large Bus Market
3.1.1 Market Size
3.1.2 Competitive Landscape
3.1.3 Market Structure
3.2 Medium Bus Market
3.2.1 Market Size
3.2.2 Competitive Landscape
3.2.3 Market Structure
3.3 Light Bus Market
3.3.1 Market Size
3.3.2 Competitive Landscape
3.3.3 Market Structure
4 New Energy Bus Market
4.1 Market Size
4.2 Competitive Landscape
4.3 Policies
4.3.1 Policies on Fiscal Subsidies
4.3.2“Oil Reduction & Electricity Compensation” Policy
4.3.3 Promotion and Assessment Methods
4.4 Technology Roadmap
4.5 Fuel Cell Bus
5 Bus Industry Chain
5.1 Upstream Raw Material Market
5.2 Key Components
5.2.1 Transmission
5.2.2 Wheel Hub
5.2.3 New Energy Battery
5.3 Downstream Demand Market
5.3.1 Passenger Transport
5.3.2 High Speed Rail
5.3.3 Tourism
6 Major Enterprises
6.1 Zhengzhou Yutong Bus Co., Ltd.
6.1.1 Profile
6.1.2 Financial Performance
6.1.3 Operating Revenue Structure
6.1.4 Output and Sales Volume
6.1.5 New Energy Bus
6.1.6 Production Capacity
6.1.7 R&D Costs
6.1.8 Cost Structure
6.1.9 Components & Parts
6.1.10 Dynamics
6.1.11 Prospects
6.2 Xiamen King Long Motor Group
6.2.1 Profile
6.2.2 Financial Performance
6.2.3 Operating Revenue Structure
6.2.4 Operation of Major Subsidiaries
6.2.5 Output and Sales Volume
6.2.6 New Energy Bus
6.2.7 Production Capacity
6.2.8 R&D Costs
6.2.9 Cost Structure
6.2.10 Dynamics
6.2.11 Prospects
6.3 Zhongtong Bus and Holding Co., Ltd.
6.3.1 Profile
6.3.2 Financial Performance
6.3.3 Operating Revenue Structure
6.3.4 Output and Sales Volume
6.3.5 New Energy Bus
6.3.6 R&D Costs
6.3.7 Cost Structure
6.3.8 Dynamics
6.3.9 Prospects
6.4 Beiqi Foton Motor Co., Ltd.
6.4.1 Profile
6.4.2 Financial Performance
6.4.3 Operating Revenue Structure
6.4.4 Output and Sales Volume
6.4.5 New Energy Bus
6.4.6 Production Capacity
6.4.7 R&D Costs
6.4.8 Prospects
6.5 Anhui Ankai Automobile Co., Ltd.
6.5.1 Profile
6.5.2 Financial Performance
6.5.3 Operating Revenue Structure
6.5.4 Output and Sales Volume
6.5.5 New Energy Bus
6.5.6 Production Capacity
6.5.7 R&D Costs
6.5.8 Cost Structure
6.6 Liaoning SG Automotive Group Co., Ltd.
6.6.1 Profile
6.6.2 Financial Performance
6.6.3 Operating Revenue Structure
6.6.4 Output and Sales Volume
6.6.5 New Energy Business
6.6.6 Cost Structure
6.7 Yangzhou Yaxing Motor Coach Co., Ltd.
6.7.1 Profile
6.7.2 Financial Performance
6.7.3 Operating Revenue Structure
6.7.4 Output and Sales Volume
6.7.5 New Energy Bus
6.7.6 R&D Costs
6.7.7 Cost Structure
6.8 BYD Company Co., Ltd.
6.8.1 Profile
6.8.2 Financial Performance
6.8.3 Operating Revenue Structure
6.8.4 Output and Sales Volume
6.8.5 New Energy Bus
6.8.6 Dynamics
6.8.7 Prospects
6.9 Anhui Jianghuai Automobile Co., Ltd.
6.9.1 Profile
6.9.2 Financial Performance
6.9.3 Operating Revenue Structure
6.9.4 Output and Sales Volume
6.9.5 R&D Costs
6.9.6 Cost Structure
6.9.7 Prospects
6.10 Shenyang Jinbei Automotive Co., Ltd.
6.10.1 Profile
6.10.2 Financial Performance
6.10.3 Operating Revenue Structure
6.10.4 Output and Sales Volume
6.10.5 R&D Costs
6.10.6 Cost Structure
6.10.7 Prospects
6.11 Jiangling Motors Co., Ltd.
6.11.1 Profile
6.11.2 Financial Performance
6.11.3 Operating Revenue Structure
6.11.4 Output and Sales Volume
6.11.5 R&D Costs
6.11.6 Prospects
6.12 Dongfeng Motor Corporation
6.12.1 Profile
6.12.2 Financial Performance
6.12.3 Operating Revenue Structure
6.12.4 Output and Sales Volume
6.12.5 R&D Costs
6.12.6 Cost Structure
6.12.7 Prospects
6.13 NAVECO Ltd.
6.13.1 Profile
6.13.2 Output and Sales Volume
6.13.3 Dynamics
6.14 Hebei Baoding Changan Bus Co., Ltd.
6.14.1 Profile
6.14.2 Output and Sales Volume
6.14.3 Dynamics
6.14.4 Operating Goals
6.15 SAIC Maxus Co., Ltd.
6.15.1 Profile
6.15.2 Output and Sales Volume
6.15.3 New Energy Business
6.15.4 Dynamics
6.16 Fujian New Forta Automobile Co., Ltd.
6.16.1 Profile
6.16.2 Output and Sales Volume
表:2005-2020年中国客车产销量
表:2005-2020年中国客车市场结构
表:2014年中国客车企业TOP10
表:2015年中国客车企业TOP10
表:2016年中国客车企业TOP10
表:2014-2016年中国主要客车企业营业收入
表:2014-2016年中国主要客车企业净利润
表:2014-2016年中国主要客车企业毛利率
表:2009-2015年中国客车进出口数量及金额
表:2009-2016年中国各类客车进口数量及金额
表:2009-2016年中国各类客车出口数量及金额
表:2015年中国客车进口来源国
表:2016年中国客车进口来源国
表:2015年中国前10大客车出口目的地
表:2016年中国前10大客车出口目的地
表:2014-2015年中国各类客车销量(分用途)
表:2016年主要中国主要客车企业销售结构(分用途)
图:2015年中国大中型座位客车市场结构(分用途)
表:2014-2015年中国各类公交车销量
图:2009-2015年中国校车销量
表:2015年主要企业天然气客车销量
表:2014-2016年中国天然气客车产销量
表:中国主要客车企业智能运营系统
表:2005-2020年中国大型客车及底盘产量
表:2005-2020年中国大型客车及底盘销量
表:2014年中国大型客车整车企业TOP10
表:2014年中国大型客车底盘企业市场份额
表:2015年中国大型客车整车企业TOP10
表:2015年中国大型客车底盘企业市场份额
表:2016年中国大型客车整车企业TOP10
表:2016年中国大型客车底盘企业市场份额
表:2014-2015年中国大型客车市场结构(分用途)
表:2005-2020年中国中型客车及底盘产量
表:2005-2020年中国中型客车及底盘销量
表:2014年中国中型客车整车企业TOP10
表:2014年中国中型客车底盘企业市场份额
表:2015年中国中型客车整车企业TOP10
表:2015年中国中型客车底盘企业市场份额
表:2016年中国中型客车整车企业TOP10
表:2016年中国中型客车底盘企业市场份额
表:2014-2015年中国中型客车市场结构(分用途)
表:2014-2015年中国中型客车市场结构(分长度)
表:2005-2020年中国轻型客车及底盘产量
表:2005-2020年中国轻型客车及底盘销量
表:2014年中国轻型客车整车企业TOP10
表:2014年中国轻型客车底盘企业市场份额
表:2015年中国轻型客车整车企业TOP10
表:2015年中国轻型客车底盘企业市场份额
表:2016年中国轻型客车整车企业TOP10
表:2016年中国轻型客车底盘企业市场份额
表:2014-2015年中国轻型客车市场结构(分长度)
表:2015年-2016年中国新能源客车月度产量
图:2015-2016年中国新能源客车市场结构
图:2011-2020年中国新能源客车产量
表:2015年中国新能源客车产量TOP10(分厂商)
表:2016年中国新能源客车产量TOP10(分厂商)
表:2015年中国纯电动客车产量TOP10(分厂商)
表:2016年中国纯电动客车产量TOP10(分厂商)
表:2015年中国插电式混合动力客车产量TOP 10(分厂商)
表:2016年中国插电式混合动力客车产量TOP 10(分厂商)
表:2016年电动客车补贴标准
表:2014-2015年中国电动客车补贴标准(中央财政)
表:2016年中国燃料电池汽车补贴标准
表:2014-2015年中国主要客车企业原材料成本对比
表:中国商用车变速器主要企业市场份额
表:中国主要商用车变速器配套企业
表:中国主要客车企业轮毂供应商
表:2004-2016年中国公路客运情况
表:2013-2015年中国高铁营业里程
图:2013-2015年中国高铁客运量
图:2001-2015年中国旅游业总收入
表:2008-2016年中国黄金周游客数量
表:2010-2016年宇通客车主要财务指标
表:2013-2015年宇通客车主营收入构成(分业务)
表:2013-2015年宇通客车主营收入构成(分区域)
表:2009-2016年宇通客车各类产品产销量
图:2015年宇通客车销售结构
表:2014-2016年宇通新能源客车产量
图:2012-2015年宇通新能源客车销量
表:2015年宇通客车各类新能源客车销量
表:2009-2015年宇通客车研发费用
表:2013-2015年宇通客车产品成本构成
表:2015-2020年宇通客车营业收入、净利润及毛利率预测
表:2010-2016年金龙汽车主要财务指标
表:2013-2015年金龙汽车主营收入构成(分区域)
表:2013-2015年金龙汽车主要子公司营业收入及净利润
表:2009-2016年金龙汽车各子公司客车产量
表:2009-2016年金龙汽车各子公司客车销量
表:2014-2016年金龙新能源客车产量
表:2015年金龙各类新能源客车销量(分长度)
表:2015年金龙各类新能源客车销量(分用途)
表:金龙新能源客车核心零部件外购比例
表:2010-2015年金龙汽车研发费用
表:2013-2015年金龙汽车成本构成
表:2015-2020年金龙汽车营业收入、净利润及毛利率
表:2010-2016年中通客车主要财务指标
表:2013-2015年中通客车主营收入构成(分业务)
表:2013-2015年中通客车主营收入构成(分区域)
表:2009-2016年中通客车产销量
表:2014-2016年中通新能源客车产量
表:2012-2015年中通客车研发费用
表:2013-2015年中通客车成本构成
表:2015-2020年中通客车营业收入、净利润及毛利率
表:2010-2016年福田汽车主要财务指标
表:2013-2015年福田汽车主营收入构成(分业务)
表:2013-2015年福田汽车主营收入构成(分区域)
表:2009-2016年福田汽车各类客车产销量
表:2014-2016年福田新能源客车产量
图:2013-2016年福田欧辉新能源客车销量
表:2016年福田欧辉新能源客车订单
表:2010-2015年福田汽车研发费用
表:2015-2020年福田汽车营业收入、净利润及毛利率
表:2010-2016年安凯客车财务指标
表:2013-2015年安凯客车主营收入构成(分业务)
表:2013-2015年安凯客车主营收入构成(分区域)
表:2009-2016年安凯客车产销量
表:2014-2016年安凯新能源客车产量
表:2010-2015年安凯客车研发费用
表:2015年安凯客车成本构成
表:2010-2016年曙光股份财务指标
表:2013-2015年曙光股份主营收入构成(分业务)
表:2013-2014年曙光股份主营收入构成(分区域)
表:2009-2016年曙光股份(丹东黄海)客车产销量
表:2014-2016年曙光股份黄海新能源客车产量
表:2013-2015年曙光股份成本构成
表:2010-2016年亚星客车财务指标
表:2013-2015年亚星客车主营收入构成(分业务)
表:2013-2015年亚星客车主营收入构成(分区域)
表:2009-2016年亚星客车产销量
表:2014-2016年亚星新能源客车产量
表:2014-2015年亚星新能源客车销量
表:2015年亚星新能源客车补贴收入
表:2010-2015年亚星客车研发费用
表:2013-2015年亚星客车成本构成
表:2010-2016年比亚迪财务指标
表:2013-2015年比亚迪主营收入构成(分业务)
表:2013-2015年比亚迪主营收入构成(分区域)
表:2011-2016年比亚迪客车产销量
表:比亚迪新能源客车主要产品
表:2014-2016年比亚迪新能源客车产量
图:2013-2016年比亚迪新能源客车销量
表:比亚迪中标深圳3024 辆纯电动公交客车更新解决方案项目
表:2015-2020年比亚迪营业收入、净利润及毛利率
表:2010-2016年江淮汽车财务指标
表:2013-2015年江淮汽车主营收入构成(分业务)
表:2013-2015年江淮汽车主营收入构成(分区域)
表:2009-2016年江淮汽车客车产销量
表:2010-2015年江淮汽车研发费用
表:2015年江淮汽车成本构成
表:2015-2020年江淮汽车营业收入、净利润及毛利率
表:2010-2016年金杯汽车财务指标
表:2013-2015年金杯汽车主营收入构成(分业务)
表:2013-2015年金杯汽车主营收入构成(分区域)
表:2009-2015年金杯汽车客车产销量
表:2012-2015年金杯汽车研发费用
表:2013-2015年金杯汽车成本构成
表:2015-2020年金杯汽车营业收入、净利润及毛利率
表:2010-2016年江铃汽车财务指标
表:2013-2015年江铃汽车主营收入构成(分业务)
表:2013-2014年江铃汽车主营收入构成(分区域)
表:2009-2016年江铃汽车客车产销量
表:2010-2015年江铃汽车研发费用
表:2015-2018年江铃汽车营业收入、净利润及毛利率
表:2010-2016年东风汽车财务指标
表:2013-2015年东风汽车主营收入构成(分业务)
表:2013-2015年东风汽车主营收入构成(分区域)
表:2009-2015年东风汽车客车产销量
表:2010-2015年东风汽车研发费用
表:2013-2015年东风汽车成本构成
表:2015-2020年东风汽车营业收入、净利润及毛利率
表:2011-2016年上汽大通客车产销量
表:2015年上汽大通产能(包括新能源)
表:2015年上汽大通在建工程
表:2015年上汽大通新能源汽车产销量及销售收入
Output and Sales Volume of Buses in China, 2005-2020E
Market Structure of Buses in China, 2005-2020E
TOP10 Bus Manufacturers in China, 2014
TOP10 Bus Manufacturers in China, 2015
TOP10 Bus Manufacturers in China, 2016
Revenue of Major Bus Manufacturers in China, 2014-2016
Net Income of Major Bus Manufacturers in China, 2014-2016
Gross Margin of Major Bus Manufacturers in China, 2014-2016
Import & Export Volume and Value of Buses in China, 2009-2015
Import Volume and Value of Buses in China by Type, 2009-2016
Export Volume and Value of Buses in China by Type, 2009-2016
China’s Bus Import Sources, 2015
China’s Bus Import Sources, 2016
China’s Top 10 Bus Export Destinations, 2015
China’s Top 10 Bus Export Destinations, 2016
Sales Volume of Buses in China by Purpose, 2014-2015
Sales Structure of Major Bus Manufacturers in China by Purpose, 2016
Market Structure of Large and Medium-sized Seat Buses in China by Purpose, 2015
Sales Volume of Buses in China by Type, 2014-2015
Sales Volume of School Buses in China, 2009-2015
Natural Gas Bus Sales Volume of Major Enterprises, 2015
Output and Sales Volume of Natural Gas Buses in China, 2014-2016
Intelligent Operation System of Major Bus Manufacturers in China
Output of Large Buses and Chassis in China, 2005-2020E
Sales Volume of Large Buses and Chassis in China, 2005-2020E
TOP10 Large Bus Manufacturers in China, 2014
Market Share of Large Bus Chassis Manufacturers in China, 2014
TOP10 Large Bus Manufacturers in China, 2015
Market Share of Large Bus Chassis Manufacturers in China, 2015
TOP10 Large Bus Manufacturers in China, 2016
Market Share of Large Bus Chassis Manufacturers in China, 2016
Market Structure of Large Buses in China by Purpose, 2014-2015
Output of Medium-sized Buses and Chassis in China, 2005-2020E
Sales Volume of Medium-sized Buses and Chassis in China, 2005-2020E
TOP10 Medium-sized Bus Manufacturers in China, 2014
Market Share of Medium-sized Bus Chassis Manufacturers in China, 2014
TOP10 Medium-sized Bus Manufacturers in China, 2015
Market Share of Medium-sized Bus Chassis Manufacturers in China, 2015
TOP10 Medium-sized Bus Manufacturers in China, 2016
Market Share of Medium-sized Bus Chassis Manufacturers in China, 2016
Market Structure of Medium-sized Buses in China by Purpose, 2014-2015
Market Structure of Medium-sized Buses in China by Length, 2014-2015
Output of Light Buses and Chassis in China, 2005-2020E
Sales Volume of Light Buses and Chassis in China, 2005-2020E
TOP10 Light Bus Manufacturers in China, 2014
Market Share of Light Bus Chassis Manufacturers in China, 2014
TOP10 Light Bus Manufacturers in China, 2015
Market Share of Light Bus Chassis Manufacturers in China, 2015
TOP10 Light Bus Manufacturers in China, 2016
Market Share of Light Bus Chassis Manufacturers in China, 2016
Market Structure of Light Buses in China by Length, 2014-2015
Monthly Output of New Energy Buses in China, 2015-2016
Market Structure of New Energy Buses in China, 2015-2016
Output of New Energy Buses in China, 2011-2020E
TOP10 New Energy Bus Manufacturers in China by Output, 2015
TOP10 New Energy Bus Manufacturers in China by Output, 2016
TOP10 Battery Electric Bus Manufacturers in China by Output, 2015
TOP10 Battery Electric Bus Manufacturers in China by Output, 2016
TOP10 Plug-in Hybrid Electric Bus Manufacturers in China by Output, 2015
TOP10 Plug-in Hybrid Electric Bus Manufacturers in China by Output, 2016
Subsidy Standard for Electric Buses, 2016
Electric Bus Subsidy Standard from China’s Central Government Budget, 2014-2015
Subsidy Standard for Fuel Cell Cars in China, 2016
Cost of Raw Materials of Major Bus Manufacturers in China, 2014-2015
Market Share of Major Commercial Vehicle Transmission Manufacturers in China
Major Suppliers of Commercial Vehicle Transmission in China
Wheel Hub Suppliers of Major Bus Manufacturers in China
Highway Passenger Transportation in China, 2004-2016
High-speed Rail Mileage in China, 2013-2015
Passenger Capacity of High-speed Rail in China, 2013-2015
Total Tourism Revenue in China, 2001-2015
Number of Tourists during the Chinese Golden Week Holiday, 2008-2016
Main Financial Indicators of Yutong Bus, 2010-2016
Operating Revenue Structure of Yutong Bus by Business, 2013-2015
Operating Revenue Structure of Yutong Bus by Region, 2013-2015
Output and Sales Volume of Yutong Bus by Product, 2009-2016
Sales Structure of Yutong Bus, 2015
New Energy Bus Output of Yutong Bus, 2014-2016
New Energy Bus Sales Volume of Yutong Bus, 2012-2015
New Energy Bus Sales Volume of Yutong Bus by Type, 2015
R&D Costs of Yutong Bus, 2009-2015
Product Cost Structure of Yutong Bus, 2013-2015
Revenue, Net Income, and Gross Margin of Yutong Bus, 2015-2020E
Main Financial Indicators of Xiamen King Long Motor Group, 2010-2016
Operating Revenue Structure of Xiamen King Long Motor Group by Region, 2013-2015
Revenue and Net Income of Major Subsidiaries of Xiamen King Long Motor Group, 2013-2015
Bus Output of Subsidiaries of Xiamen King Long Motor Group, 2009-2016
Bus Sales Volume of Subsidiaries of Xiamen King Long Motor Group, 2009-2016
New Energy Bus Output of Xiamen King Long Motor Group, 2014-2016
New Energy Bus Sales Volume of Xiamen King Long Motor Group by Length, 2015
New Energy Bus Sales Volume of Xiamen King Long Motor Group by Purpose, 2015
Percentage of Purchased Key Parts for New Energy Bus of Xiamen King Long Motor Group
R&D Costs of Xiamen King Long Motor Group, 2010-2015
Cost Structure of Xiamen King Long Motor Group, 2013-2015
Revenue, Net Income, and Gross Margin of Xiamen King Long Motor Group, 2015-2020E
Main Financial Indicators of Zhongtong Bus, 2010-2016
Operating Revenue Structure of Zhongtong Bus by Business, 2013-2015
Operating Revenue Structure of Zhongtong Bus by Region, 2013-2015
Output and Sales Volume of Zhongtong Bus, 2009-2016
New Energy Bus Output of Zhongtong Bus, 2014-2016
R&D Costs of Zhongtong Bus, 2012-2015
Cost Structure of Zhongtong Bus, 2013-2015
Revenue, Net Income, and Gross Margin of Zhongtong Bus, 2015-2020E
Main Financial Indicators of Beiqi Foton Motor, 2010-2016
Operating Revenue Structure of Beiqi Foton Motor by Business, 2013-2015
Operating Revenue Structure of Beiqi Foton Motor by Region, 2013-2015
Bus Output and Sales Volume of Beiqi Foton Motor by Type, 2009-2016
New Energy Bus Output of Beiqi Foton Motor, 2014-2016
New Energy Bus Sales Volume of FOTON AUV, 2013-2016
New Energy Bus Orders of FOTON AUV, 2016
R&D Costs of Beiqi Foton Motor, 2010-2015
Revenue, Net Income, and Gross Margin of Beiqi Foton Motor, 2015-2020E
Financial Indicators of Anhui Ankai Automobile, 2010-2016
Operating Revenue Structure of Anhui Ankai Automobile by Business, 2013-2015
Operating Revenue Structure of Anhui Ankai Automobile by Region, 2013-2015
Output and Sales Volume of Anhui Ankai Automobile, 2009-2016
New Energy Bus Output of Anhui Ankai Automobile, 2014-2016
R&D Costs of Anhui Ankai Automobile, 2010-2015
Cost Structure of Anhui Ankai Automobile, 2015
Financial Indicators of SG Automotive Group, 2010-2016
Operating Revenue Structure of SG Automotive Group by Business, 2013-2015
Operating Revenue Structure of SG Automotive Group by Region, 2013-2014
Huanghai Bus Output and Sales Volume of SG Automotive Group, 2009-2016
Huanghai New Energy Bus Output of SG Automotive Group, 2014-2016
Cost Structure of SG Automotive Group, 2013-2015
Financial Indicators of Asiastar, 2010-2016
Operating Revenue Structure of Asiastar by Business, 2013-2015
Operating Revenue Structure of Asiastar by Region, 2013-2015
Output and Sales Volume of Asiastar, 2009-2016
New Energy Bus Output of Asiastar, 2014-2016
New Energy Bus Sales Volume of Asiastar, 2014-2015
Asiastar’s Subsidy Income from New Energy Bus, 2015
R&D Costs of Asiastar, 2010-2015
Cost Structure of Asiastar, 2013-2015
Financial Indicators of BYD, 2010-2016
Operating Revenue Structure of BYD by Business, 2013-2015
Operating Revenue Structure of BYD by Region, 2013-2015
Bus Output and Sales Volume of BYD, 2011-2016
Main New Energy Buses of BYD
New Energy Bus Output of BYD, 2014-2016
New Energy Bus Sales Volume of BYD, 2013-2016
BYD Won the Tender of Shenzhen’s Solution Project for Upgrading 3,024 Battery Electric Buses
Revenue, Net Income, and Gross Margin of BYD, 2015-2020E
Financial Indicators of JAC, 2010-2016
Operating Revenue Structure of JAC by Business, 2013-2015
Operating Revenue Structure of JAC by Region, 2013-2015
Bus Output and Sales Volume of JAC, 2009-2016
R&D Costs of JAC, 2010-2015
Cost Structure of JAC, 2015
Revenue, Net Income, and Gross Margin of JAC, 2015-2020E
Financial Indicators of Jinbei Auto, 2010-2016
Operating Revenue Structure of Jinbei Auto by Business, 2013-2015
Operating Revenue Structure of Jinbei Auto by Region, 2013-2015
Bus Output and Sales Volume of Jinbei Auto, 2009-2015
R&D Costs of Jinbei Auto, 2012-2015
Cost Structure of Jinbei Auto, 2013-2015
Revenue, Net Income, and Gross Margin of Jinbei Auto, 2015-2020E
Financial Indicators of JMC, 2010-2016
Operating Revenue Structure of JMC by Business, 2013-2015
Operating Revenue Structure of JMC by Region, 2013-2014
Bus Output and Sales Volume of JMC, 2009-2016
R&D Costs of JMC, 2010-2015
Revenue, Net Income, and Gross Margin of JMC, 2015-2018E
Financial Indicators of Dongfeng Motor, 2010-2016
Operating Revenue Structure of Dongfeng Motor by Business, 2013-2015
Operating Revenue Structure of Dongfeng Motor by Region, 2013-2015
Bus Output and Sales Volume of Dongfeng Motor, 2009-2015
R&D Costs of Dongfeng Motor, 2010-2015
Cost Structure of Dongfeng Motor, 2013-2015
Revenue, Net Income, and Gross Margin of Dongfeng Motor, 2015-2020E
Bus Output and Sales Volume of SAIC MAXUS, 2011-2016
Capacity of SAIC MAXUS (including New Energy), 2015
Ongoing Projects of SAIC MAXUS, 2015
New Energy Vehicle Output, Sales Volume, and Revenue of SAIC MAXUS, 2015
如果这份报告不能满足您的要求,我们还可以为您定制报告,请 留言说明您的详细需求。
|