|
|
|
报告导航:研究报告—
制造业—汽车
|
|
2016-2020年中国汽车经销及汽车后市场行业研究报告 |
 |
字数:4.6万 |
页数:149 |
图表数:192 |
|
中文电子版:8000元 |
中文纸版:4000元 |
中文(电子+纸)版:8500元 |
|
英文电子版:2200美元 |
英文纸版:2400美元 |
英文(电子+纸)版:2500美元 |
|
编号:ZLC-041
|
发布日期:2016-12 |
附件:下载 |
 |
|
|
受竞争加剧、运营成本上升、库存压力增长等因素影响,以及在电商模式逐步兴起的冲击下,汽车经销行业面临着很大的压力,2015年中国4S店数量同比减少920家。未来,中国4S店数量还将缩减,而汽车电商、汽车超市等多品牌汽车经营模式将逐步发展起来。
在汽车经销行业发展疲软的情形下,利润率相对更高的汽车金融、汽修美容、二手车等汽车后市场行业则迅速发展。2015年,中国汽车后市场整体规模达21,540亿元,其中汽车金融和汽修美容市场规模分别达8,500亿元和7,550亿元。
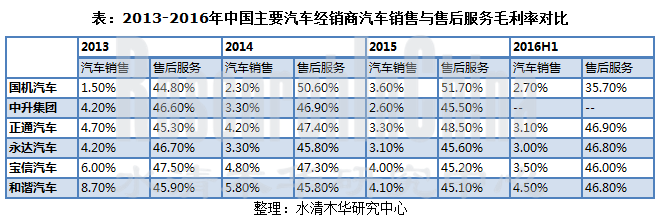
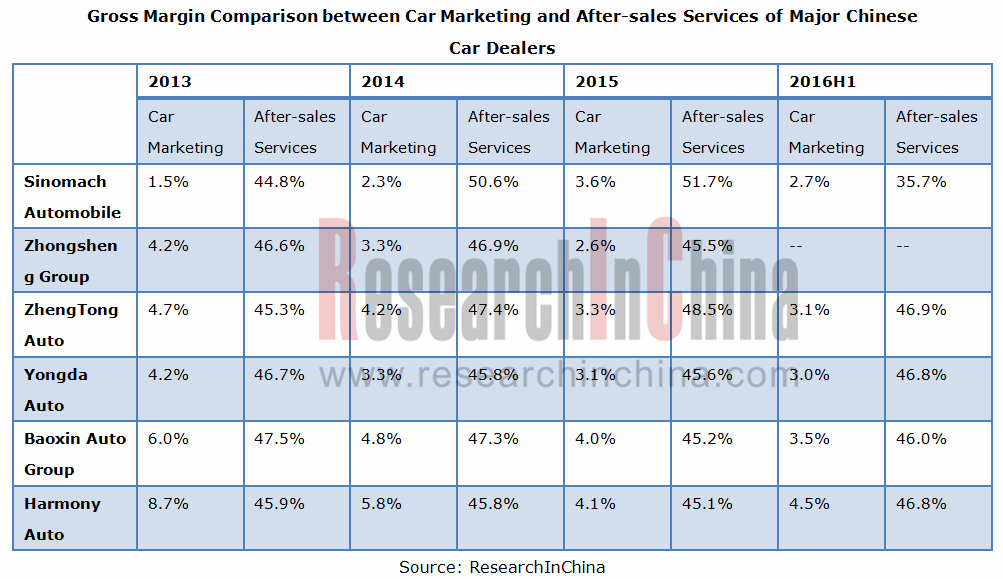
近几年,中国汽车经销商汽车销售毛利率基本不到5%,且整体呈下滑趋势,与售后服务高达40%以上的毛利率相差巨大。
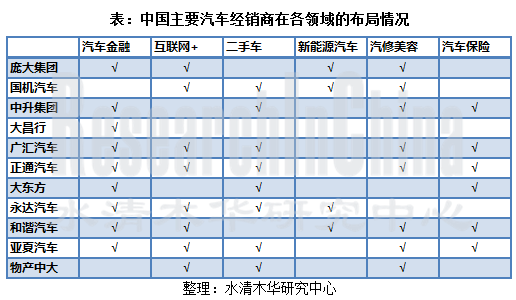
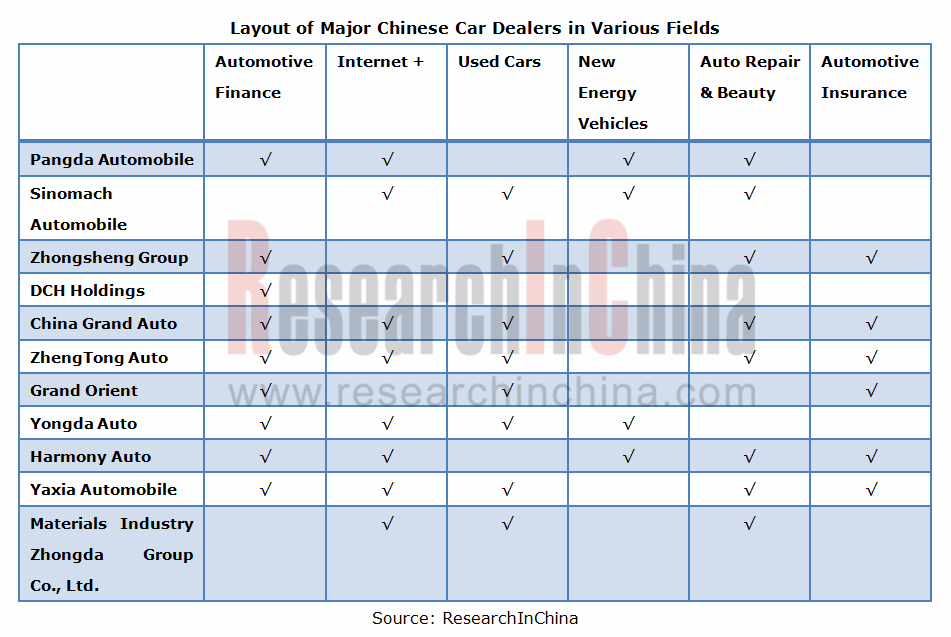
在面临毛利率下滑,库存压力大,经济效益逐步下滑的情形下,部分经销商或通过产业并购,或通过拓展汽车后市场,或通过打造线上线下结合的经营模式,或通过布局新能源汽车等领域以寻求发展。
产业并购案例:2016年,广汇汽车先后收购了宝信汽车、大连尊荣、深圳鹏峰汽车等汽车经销集团,扩大公司销售网络,进一步巩固公司汽车经销商龙头的位置。
汽车后市场布局案例:2015年,国机汽车与辉门汽车零部件公司成立中汽辉门汽车技术服务(北京)有限公司,致力于在汽车后市场建立起以汽车维修保养为主的业务网络,以“产品+服务”为核心,建立线上线下规范生态链,为中高端品牌汽车客户提供综合维修解决方案。
互联网+布局案例:2015年,广汇汽车陆续与阿里巴巴、易车网、汽车之家展开合作,建立O2O平台,为消费者提供从选车、贷款、车辆保险、车辆交付、保养车、二手车置换、二手车贷款等服务。
新能源汽车布局案例:2014年,庞大集团便与北汽合资设立庞大北汽新能源汽车销售有限公司,2015年公司新能源汽车销量约1.4万辆。此外,公司还在北京五方桥地区建成电动汽车一条街和电动汽车试乘试驾场,在天津建成新能源汽车大卖场,在唐山建成新能源汽车租售体验中心,在沈阳建成新能源汽车超市。
《2016-2020年中国汽车经销及汽车后市场行业研究报告》主要包括以下内容:
 中国汽车经销概况及竞争格局分析,包括市场现状、经销模式、盈利模式、竞争格局及发展趋势分析; 中国汽车经销概况及竞争格局分析,包括市场现状、经销模式、盈利模式、竞争格局及发展趋势分析;
中国新车销售市场分析,包括汽车整体市场分析、乘用车、商用车、新能源汽车市场分析及发展趋势分析;
中国二手车销售市场分析、汽车金融市场分析、汽修美容市场分析以及汽车保险市场分析;
对12家汽车经销商的经营情况、布局情况、销售情况、发展情况等各方面进行分析。
Given fiercer competition, rising operating costs, huger inventory pressure and other factors, as well as the impact of the emerging e-business mode, the automotive distribution industry is facing an enormous challenge. In 2015, the number of 4S shops in China reduced by 920 year on year, and in the future the number will shrink further, while automotive e-business, automobile supermarkets and other multi-brand automotive business models will grow up.
Amid the weak development of the automotive distribution industry, the automotive aftermarket, covering automotive finance, auto repair & beauty and used cars, has sprung up with higher profit margins. In 2015, the overall size of Chinese automotive aftermarket reached RMB2,154 billion, of which RMB850 billion and RMB755 billion stemmed from automotive finance and auto repair & beauty respectively.
In recent years, Chinese car dealers have only garnered the car sales gross margin of less than 5%, with an overall downward trend; whereas, after-sales services enjoy the gross margin of above 40%.
In the face of lower gross margins, massive inventory and the gradual decline in economic benefits, some dealers have to seek further development through mergers and acquisitions, or expansion of the automotive aftermarket, or the combination of online and offline business, or layout in the field of new energy vehicles.
M & A: In 2016, China Grand Auto acquired Baoxin Auto Group, Dalian Zunrong Auto Trade Co., Ltd., Peng Feng Group and other car distribution groups to expand sales network and further consolidate its leading position.
Automotive Aftermarket Layout: In 2015, Sinomach Automobile and Federal-Mogul co-founded Federal-Mogul CAIEC Automotive Technology Services (Beijing) Co., Ltd. to establish a car repair & maintenance-based business network in the automotive aftermarket and an online + offline standardized ecosystem centering on "products + services", as well as provide comprehensive maintenance solutions for medium and high-end brand car customers.
Internet + Layout: In 2015, China Grand Auto cooperated with Alibaba, yiche.com and autohome.com.cn to set up an O2O platform serving consumers in car selection, loans, insurance, delivery, maintenance, replacement, second-hand car loans, and among others.
New Energy Vehicle Layout: In 2014, PANGDA Automobile Trade Group set up a joint venture – Pangda- BAIC New Energy Vehicle Sales Co, Ltd. with BAIC. In 2015, PANGDA Automobile sold about 14,000 new energy vehicles. In addition, PANGDA Automobile also erected an electric vehicle street and an electric vehicle test drive field in Wufangqiao, Beijing, a new energy vehicle hypermarket in Tianjin, a new energy vehicle leasing & sale experience center in Tangshan city, and a new energy vehicle supermarket in Shenyang city.
China Automotive Distribution and Aftermarket Report, 2016-2020 involves the following:
 Overview and competitive landscape of automotive distribution (including status quo, distribution mode, profit model, competitive landscape and development tendency) in China; Overview and competitive landscape of automotive distribution (including status quo, distribution mode, profit model, competitive landscape and development tendency) in China;
Sales market of new vehicle in China (including overall market, passenger cars, commercial vehicles, new energy vehicles, development trends, etc.);
Analysis on used car sales market, auto finance market, auto repair & beauty market and auto insurance market in China;
Operation, layout, sale, development, etc. of 12 car dealers.
第一章 概述
1.1 发展历程
1.2 经销模式
1.2.1 主要营销模式
1.2.2 营销模式特点
1.2.3 进口汽车经销模式
1.3 汽车后市场
1.3.1 市场现状
1.3.2 主要渠道
1.3.3 发展现状
1.4 发展趋势
第二章 中国汽车经销概况及竞争格局分析
2.1 市场现状
2.2 经销模式
2.2.1 乘用车经销模式
2.2.2 商用车经销模式
2.3 盈利模式
2.4 竞争格局
2.4.1 百强总体收入情况
2.4.2 企业经营对比
2.4.3 4S店数量对比
2.5 发展趋势
2.5.1 产业并购不断市场集中度进一步提升
2.5.2 加大力度拓展汽车后市场
2.5.3 汽车经销向“互联网+”发展
2.5.4 布局新能源汽车领域
第三章 中国新车销售市场分析
3.1 汽车市场
3.1.1 产量
3.1.2 销量
3.1.3 进口量
3.2 乘用车市场
3.2.1 产量
3.2.2 销量
3.2.3 进口量
3.3 商用车市场
3.3.1 产量
3.3.2 销量
3.3.3 进口量
3.4 新能源汽车
3.4.1 产销量
3.4.2 发展前景
3.5 发展趋势
3.5.1 汽车经销互联网化
3.5.2 新能源汽车销量增长迅速
3.5.3 二胎政策推动行业发展
3.5.4 二手车销量增长
3.5.5 汽车金融的迅速发展推动汽车经销行业发展
第四章 中国二手车销售市场分析
4.1 市场现状
4.2 经销模式
4.3 交易情况
4.3.1 整体市场
4.3.2 市场结构
4.3.3 区域市场
4.4 竞争格局
4.5 发展前景
4.5.1 取消二手车限迁政策利好行业发展
4.5.2 二手车电商模式推进市场发展
4.5.3 二手车交易量预测
第五章 中国汽车金融市场分析
5.1 发展现状
5.2 市场规模
5.3 竞争格局
5.4 发展趋势
5.4.1 国内整车厂商加速布局汽车金融领域
5.4.2 新能源和二手车金融获政策支持发展潜力大
5.4.3 汽车互联网金融成发展趋势
5.4.4 银行和企业合作是汽车金融发展方向
5.4.5 汽车金融行业竞争加剧
5.4.6 资金来源逐步专业化、多样化
5.4.7 国际化
第六章 中国汽修美容市场分析
6.1 市场规模
6.2 投融资分析
6.3 竞争格局
6.4 渠道分析
6.5 区域分析
6.6 发展趋势
6.6.1 总体发展趋势
6.6.2 渠道发展趋势
6.7 互联网+汽修美容
6.7.1 发展现状
6.7.2 经营模式
6.7.3 竞争格局
第七章 中国汽车保险市场分析
7.1 发展现状
7.2 市场规模
第八章 中国主要汽车经销商
8.1 庞大集团
8.1.1 公司简介
8.1.2 经营模式及盈利模式
8.1.3 经营情况
8.1.4 营收构成
8.1.5 毛利率
8.1.6 布局情况
8.1.7 销售情况
8.1.8 客户情况
8.1.9 与京东金融合作,布局汽车互联网金融
8.1.10 发展情况
8.2 国机汽车
8.2.1 公司简介
8.2.2 经营情况
8.2.3 营收构成
8.2.4 毛利率
8.2.5 进口汽车业务
8.2.6 销售情况
8.2.7 发展情况
8.3 中升集团
8.3.1 公司简介
8.3.2 经营情况
8.3.3 营收构成
8.3.4 毛利率
8.3.5 销售情况
8.3.6 布局情况
8.3.7 发展情况
8.4 大昌行
8.4.1 公司简介
8.4.2 经营情况
8.4.3 营收构成
8.4.4 毛利率
8.4.5 汽车经销业务
8.4.6 发展情况
8.5 广汇汽车
8.5.1 公司简介
8.5.2 经营情况
8.5.3 营收构成
8.5.4 毛利率
8.5.5 汽车经销业务
8.5.6 二手车业务
8.5.7 收购宝信汽车
8.5.8 收购深圳鹏峰17家4S店
8.5.9 布局互联网和二手车汽车金融
8.5.10 发展情况
8.6 正通汽车
8.6.1 公司简介
8.6.2 经营情况
8.6.3 营收构成
8.6.4 毛利率
8.6.5 布局情况
8.6.6 销售情况
8.6.7 发展情况
8.7 大东方
8.7.1 公司简介
8.7.2 经营情况
8.7.3 营收构成
8.7.4 毛利率
8.7.5 汽车经销业务
8.8 永达汽车
8.8.1 公司简介
8.8.2 经营情况
8.8.3 营收构成
8.8.4 毛利率
8.8.5 汽车经销业务
8.8.6 二手车经销业务
8.8.7 汽车金融业务
8.8.8 发展情况
8.9 宝信汽车
8.9.1 公司简介
8.9.2 经营情况
8.9.3 营收构成
8.9.4 毛利率
8.9.5 布局情况
8.9.6 汽车经销业务
8.10 和谐汽车
8.10.1 公司简介
8.10.2 经营情况
8.10.3 营收构成
8.10.4 毛利率
8.10.5 布局情况
8.10.6 销售情况
8.10.7 发展情况
8.11 亚夏汽车
8.11.1 公司简介
8.11.2 经营情况
8.11.3 营收构成
8.11.4 毛利率
8.11.5 汽车经销业务
8.11.6 汽车金融业务
8.11.7 发展情况
8.12 物产中大
8.12.1 公司简介
8.12.2 经营情况
8.12.3 营收构成
8.12.4 汽车经销业务
8.12.5 浙江物产元通汽车集团有限公司
8.12.6 发展情况
1 Overview
1.1 Development History
1.2 Distribution Pattern
1.2.1 Main Marketing Models
1.2.2 Characteristics of Marketing Models
1.2.3 Imported Car Distribution Pattern
1.3 Automotive Aftermarket
1.3.1 Market Situation
1.3.2 Main Channels
1.3.3 Status Quo
1.4 Development Trend
2 Overview and Competitive Landscape of Automotive Distribution in China
2.1 Market Situation
2.2 Distribution Model
2.2.1 Passenger Car Distribution Model
2.2.2 Commercial Vehicle Distribution Model
2.3 Profit Model
2.4 Competitive Landscape
2.4.1 Revenue of Top 100 Companies
2.4.2 Comparison by Enterprises’ Operation
2.4.3 Comparison by Quantity of 4S Shops
2.5 Development Trends
2.5.1 Continuous Industrial M&As Further Raise Market Concentration
2.5.2 More Efforts to Expand Automotive Aftermarket
2.5.3 Automotive Distribution Heads towards "Internet +"
2.5.4 Layout of New Energy Vehicle Field
3 Sales Market of New Vehicle in China
3.1 Automobile Market
3.1.1 Output
3.1.2 Sales Volume
3.1.3 Import Volume
3.2 Passenger Car Market
3.2.1 Output
3.2.2 Sales Volume
3.2.3 Import Volume
3.3 Commercial Vehicle Market
3.3.1 Output
3.3.2 Sales Volume
3.3.3 Import Volume
3.4 New Energy Vehicles
3.4.1 Output and Sales Volume
3.4.2 Prospects
3.5 Development Trends
3.5.1 Internet-based Automotive Distribution
3.5.2 Sales Volume of New Energy Vehicle Soars
3.5.3 Second Child Policy Promotes the Development of the Industry
3.5.4 Used Car Sales Volume Grows
3.5.5 The Rapid Development of Automotive Finance Boosts the Development of Automotive Distribution Industry
4 Chinese Used Car Sales Market
4.1 Market Situation
4.2 Distribution Model
4.3 Transaction
4.3.1 Overall Market
4.3.2 Market Structure
4.3.3 Regional Market
4.4 Competitive Landscape
4.5 Prospects
4.5.1 Cancellation of Used Car Immigration Restriction Policy Favors the Development of the Industry
4.5.2 Used Car E-Business Model Promotes Market Development
4.5.3 Forecast for Used Car Trading Volume
5 Chinese Automotive Finance Market
5.1 Status Quo
5.2 Market Size
5.3 Competitive Landscape
5.4 Development Trends
5.4.1 Domestic Vehicle Manufacturers Accelerate the Layout in the Automotive Finance Field
5.4.2 New Energy and Used Car Finance Backed by Policies Show Great Development Potentials
5.4.3 Automotive Internet Finance Becomes the Development Trend
5.4.4 Cooperation between Banks and Enterprises Represents the Development Direction of Automotive Finance
5.4.5 Competition in the Automotive Finance Industry Intensifies
5.4.6 Gradual Specialization and Diversification of Capital Sources
5.4.7 Globalization
6 Chinese Auto Repair & Beauty Market
6.1 Market Size
6.2 Investment and Financing
6.3 Competitive Landscape
6.4 Analysis of Channels
6.5 Regional Analysis
6.6 Development Trend
6.6.1 Overall
6.6.2 Channels
6.7 Internet + Auto Repair & Beauty
6.7.1 Status Quo
6.7.2 Business Model
6.7.3 Competitive Landscape
7 Chinese Auto Insurance Market
7.1 Status Quo
7.2 Market Size
8 Majors Car Dealers in China
8.1 PANGDA Automobile Trade Group Co., Ltd.
8.1.1 Profile
8.1.2 Business Model and Profit Model
8.1.3 Operation
8.1.4 Revenue Structure
8.1.5 Gross Margin
8.1.6 Layout
8.1.7 Marketing
8.1.8 Customers
8.1.9 Layout of Automotive Internet Finance in Cooperation with JD Finance
8.1.10 Development
8.2 Sinomach Automobile Co., Ltd.
8.2.1 Profile
8.2.2 Operation
8.2.3 Revenue Structure
8.2.4 Gross Margin
8.2.5 Imported Car Business
8.2.6 Marketing
8.2.7 Development
8.3 Zhongsheng Group
8.3.1 Profile
8.3.2 Operation
8.3.3 Revenue Structure
8.3.4 Gross Margin
8.3.5 Marketing
8.3.6 Layout
8.3.7 Development
8.4 Dah Chong Hong Holdings Limited (DCH Holdings)
8.4.1 Profile
8.4.2 Operation
8.4.3 Revenue Structure
8.4.4 Gross Margin
8.4.5 Automotive Distribution Business
8.4.6 Development
8.5 China Grand Automotive Services Co., Ltd.
8.5.1 Profile
8.5.2 Operation
8.5.3 Revenue Structure
8.5.4 Gross Margin
8.5.5 Automotive Distribution Business
8.5.6 Used Car Business
8.5.7 Acquisition of Baoxin Auto Group
8.5.8 Acquisition of Peng Feng Group’s 17 4S shops
8.5.9 Layout of Internet and Used Car Finance
8.5.10 Development
8.6 China ZhengTong Auto Services Holdings Limited
8.6.1 Profile
8.6.2 Operation
8.6.3 Revenue Structure
8.6.4 Gross Margin
8.6.5 Layout
8.6.6 Marketing
8.6.7 Development
8.7 Wuxi Commercial Mansion Grand Orient Co., Ltd.
8.7.1 Profile
8.7.2 Operation
8.7.3 Revenue Structure
8.7.4 Gross Margin
8.7.5 Automotive Distribution Business
8.8 China Yongda Automobile Services Holdings Limited
8.8.1 Profile
8.8.2 Operation
8.8.3 Revenue Structure
8.8.4 Gross Margin
8.8.5 Automotive Distribution Business
8.8.6 Used Car Distribution Business
8.8.7 Automotive Finance
8.8.8 Development
8.9 Baoxin Auto Group
8.9.1 Profile
8.9.2 Operation
8.9.3 Revenue Structure
8.9.4 Gross Margin
8.9.5 Layout
8.9.6 Automotive Distribution Business
8.10 Harmony Auto
8.10.1 Profile
8.10.2 Operation
8.10.3 Revenue Structure
8.10.4 Gross Margin
8.10.5 Layout
8.10.6 Marketing
8.10.7 Development
8.11 Yaxia Automobile Corporation
8.11.1 Profile
8.11.2 Operation
8.11.3 Revenue Structure
8.11.4 Gross Margin
8.11.5 Automotive Distribution Business
8.11.6 Automotive Finance
8.11.7 Development
8.12 Materials Industry Zhongda Group Co., Ltd.
8.12.1 Profile
8.12.2 Operation
8.12.3 Revenue Structure
8.12.4 Automotive Distribution Business
8.12.5 Zhejiang Materials Industry Yuantong Automobile Group Co.,Ltd.
8.12.6 Development
图:中国汽车经销发展历程
图:中国汽车经销主要方式
表:中国各类汽车营销模式特点对比
图:进口与国产汽车经营模式对比
图:汽车后市场细分行业
图:2014-2020E中国汽车后市场规模
图:2006-2015年中国4S店数量
图:2015年中国汽车4S店分布
图:中国乘用车4S店建设流程
图:汽车4S 店建设成本构成
图:中国汽车经销服务范围
图:中国经销商新车销售业务盈利模式
表:经销商各类型汽车盈利能力对比
图:2010-2015年中国汽车经销商百强营业总收入
图:2010-2015年中国收入百亿以上的汽车经销商数量
图:2010-2015年中国汽车经销商百强榜首集团收入
图:2010-2015年中国汽车经销商百强整车销售量
表:2015年中国汽车经销商收入TOP20
表:2014年中国汽车经销商收入TOP20
图:2015年中国汽车经销商新车销量对比
表:2013-2016年中国主要汽车经销商营业收入对比
表:2013-2016年中国主要汽车经销商净利润对比
表:2013-2016年中国主要汽车经销商汽车销售毛利率
表:2013-2016年中国主要汽车经销商售后服务毛利率
图:2015年中国主要汽车经销商4S店数量对比
表:中国主要汽车经销商在各领域的布局情况
图:2011-2016年中国汽车产量
图:2011-2016年中国汽车产量结构(分类型)
图:2016-2020E中国汽车产量
图:2011-2016年中国汽车销量
图:2011-2016年中国汽车销量结构(分类型)
图:2016-2020E中国汽车销量
图:2011-2016年中国汽车进口量
图:2011-2016年中国汽车进口金额
图:2011-2016年中国汽车进口构成(分类型)
图:2011-2016年中国汽车进口单价
图:2011-2016年中国乘用车产量
图:2016-2020E中国乘用车产量
图:2011-2016年中国乘用车销量
图:2016-2020E中国乘用车销量
图:2011-2016年中国乘用车销量(分类型)
图:2011-2016年中国乘用车销量构成(分类型)
图:2011-2016年中国乘用车进口量
图:2011-2016年中国乘用车进口金额
图:2011-2016年中国乘用车进口单价
图:2011-2016年中国商用车产量
图:2016-2020E中国商用车产量
图:2011-2016年中国商用车销量
图:2016-2020E中国商用车销量
图:2011-2016年中国商用车销量(分类型)
图:2011-2016年中国商用车销量构成(分类型)
图:2011-2016年中国商用车进口量
图:2011-2016年中国商用车进口金额
图:2011-2016年中国商用车进口单价
图:2011-2016年中国新能源汽车(EV&PHEV)产销量
表:2015-2016年中国新能源汽车(EV&PHEV)销量(分类型)
表:2009-2016年中国新能源汽车产业相关政策
图:2016-2020E中国新能源汽车销量
图:2015-2020E中国二手车交易量
图:2012-2016年中国二手车与新车交易量比
图:全球主要国家二手车与新车交易量比
图:二手车市场发展阶段
图:中国二手车主要交易模式
表:主要国家二手车交易模式
图:2011-2016年中国二手车交易量及同比增长率
表:2014-2016年中国二手车交易量占比(分类型)
图:2015年中国二手车交易量占比(按使用年限)
图:2016年1-9月中国二手车交易量占比(按使用年限)
图:2015年中国二手车交易量占比(按价格范围)
图:2016年1-9月中国二手车交易量占比(按价格范围)
图:2015年中国二手车交易量(分地区)
图:2016年1-9月中国二手车交易量(分地区)
图:2015年中国二手车交易量占比(分地区)
图:2016年1-9月中国二手车交易量占比(分地区)
表:中国主要汽车经销商集团在二手车市场的布局情况
表:中国主要二手车交易服务平台融资情况
图:2015-2020E中国二手车交易量
表:中国汽车金融发展阶段
图:2015-2020E中国汽车金融渗透率
图:2014-2020E中国汽车金融行业市场规模
图:2015年中国汽车金融市场资金来源结构
表:中国主要汽车金融公司
图:2015年中国主要汽车金融公司经营业绩
图:2012-2020年中国汽修美容行业市场规模
表:2015-2016年汽修美容行业主要融资案例一览
图:中国汽修美容行业主要竞争者
表:中国主要线下汽修美容连锁企业
表:中国主要独立连锁汽修美容品牌对比
表:中国部分汽修美容扩张计划
表:中国汽修美容不同渠道对比分析
表:2015年中国主要汽修美容行业不同渠道商家数量对比
表:中国重点区域汽修美容连锁品牌分布
图:2015年中国汽车修理店分布
图:2015年中国汽车保养美容店分布
图:网络汽修美容的相对优势
图:互联网维修养护平台主要经营模式
表:中国部分汽修美容网络平台项目一览
表:中国汽修美容网络平台项目区域分布
图:2009-2016年中国汽车保险保费收入
图:庞大集团4S店汽车采购模式
图:庞大集团4S店汽车销售模式
图:庞大集团4S店盈利模式
图:2013-2016年庞大集团营业收入及净利润
图:2014-2016年庞大集团营业收入(分业务)
图:2014-2016年庞大集团营收构成(分业务)
图:2014-2016年庞大集团毛利率
图:2014-2016年庞大集团主要产品毛利率
图:2010-2016年庞大集团经营网点数量(分类型)
表:2015年庞大集团整车销量及库存量
表:2013-2015年庞大集团前五名客户
表:庞大集团核心竞争力
图:2013-2016年国机汽车营业收入及净利润
图:2013-2016年国机汽车营业收入(分业务)
图:2013-2016年国机汽车营业收入构成(分业务)
表:2013-2016年国机汽车营业收入(分地区)
图:2013-2016年国机汽车毛利率(分业务)
图:2008-2014年国机汽车进口汽车销售占比
表:2015年国机汽车销量及库存
图:中升集团主要合作厂家
图:2013-2016年中升集团营业收入及净利润
图:2013-2016年中升集团营业收入(分业务)
图:2013-2016年中升集团营业收入构成(分业务)
图:2013-2016年中升集团毛利率
图:2013-2015年中升集团毛利率(分业务)
图:2011-2016年中升集团新车销量
图:2011-2016年中升集团豪华品牌新车销量及占总销量比重
表:2014-2016年中升集团经销店数量(分地区)
图:2011-2016年中升集团经销店数量(分等级)
图:截至2016年6月中升集团全国布局情况
图:大昌行汽车及汽车相关业务
图:2013-2016年大昌行营业收入及净利润
图:2013-2016年大昌行营业收入(分业务)
图:2013-2016年大昌行营业收入构成(分业务)
图:2013-2016年大昌行营业收入构成(分地区)
图:2013-2016年大昌行毛利率
图:2013-2016年大昌行汽车及相关业务收入(分地区)
图:2013-2016年大昌行汽车及相关业务收入构成(分地区)
表:2011-2016年大昌行汽车销量(分地区)
图:2011-2016年大昌行4S店数量
表:截至2016上半年大昌行中国大陆地区销售渠道数量(分品牌)
图:2014-2016年广汇汽车营业收入及净利润
图:2015-2016年广汇汽车营业收入(分业务)
表:2015-2016年广汇汽车毛利率(分业务)
表:2014-2016年广汇汽车新车销量
表:截至2016年6月30日广汇汽车4S店数量(分品牌)
图:2014-2016年宝信汽车营业收入及净利润
图:2013-2016年正通汽车营业收入及净利润
表:2013-2016年正通汽车营业收入(分业务)
表:2013-2016年正通汽车营业收入构成(分业务)
图:2013-2016年正通汽车毛利率(分业务)
表:截至2015年底正通汽车经营网点数量(分类型)
表:2015年正通汽车新开经营网点
图:截至2015年底正通汽车全国布局
表:截至2016上半年正通汽车经营网点数量(分类型)
图:2013-2016年正通汽车新车销量(分品牌)
图:2013-2016年正通汽车新车销售收入(分品牌)
图:2013-2016年大东方营业收入及净利润
图:2013-2016年大东方营业收入(分业务)
图:2013-2016年大东方营业收入构成(分业务)
图:2013-2016年大东方毛利率
表:2015年大东方已开业门店分布情况
图:2013-2016年大东方汽车销售收入
表:大东方汽车销售及服务主要业务及经营模式
图:2013-2016年永达汽车营业收入及毛利
表:2013-2016年永达汽车营业收入(分业务)
表:2013-2016年永达汽车营业收入构成(分业务)
图:2013-2016年永达汽车毛利率
图:2013-2016年永达汽车毛利率(分业务)
图:截至2016年6月30日永达汽车覆盖品牌范围
表:2015年永达汽车网点数量(分类型)
图:2013-2016年永达汽车乘用车销量(分类型)
图:永达汽车金融业务
图:2014-2016年宝信汽车营业收入及净利润
图:2013-2016年宝信汽车营业收入(分业务)
图:2013-2016年宝信汽车营业收入构成(分业务)
图:2013-2016年宝信汽车毛利率(分业务)
图:2013-2016年宝信汽车汽车销售收入(分品牌)
图:2014-2016年宝信汽车销量(分类型)
图:2013-2016年和谐汽车营业收入及净利润
图:2013-2016年和谐汽车营业收入(分业务)
图:2013-2016年和谐汽车营业收入构成(分业务)
图:2013-2016年和谐汽车毛利率(分业务)
图:2013-2016年和谐汽车新车销量
图:2013-2016年亚夏汽车营业收入及净利润
表:2013-2016年亚夏汽车营业收入(分业务)
图:2013-2016年亚夏汽车营业收入构成(分业务)
图:2013-2016年亚夏汽车毛利率(分业务)
图:2012-2015年亚夏汽车汽车销量
图:2014-2016年物产中大营业收入及净利润
表:2014-2016年物产中大营业收入(分业务)
图:2014-2016年物产中大整车销售收入及占总营收比重
表:2014-2016年浙江物产元通汽车集团有限公司营业收入及净利润
Development History of Automotive Distribution in China
Major Means of Automotive Distribution in China
Comparison: Characteristics of Different Automotive Distribution Modes
Comparison: Business Model of Imported Cars and China-made Cars
Automotive Aftermarket Segments
China’s Automotive Aftermarket Size, 2014-2020E
Number of 4S Shops in China, 2006-2015
Distribution of Chinese Automotive 4S Shops, 2015
Procedures for Constructing Passenger Car 4S Shop in China
Cost Structure for Constructing 4S Shop
Service Scope of Automotive Distribution in China
Profit Model of New Car Sales of Dealers in China
Dealers’ Profitability from Different Car Models
Total Revenue of Top 100 Dealers in China, 2010-2015
Number of Car Dealers with the Revenue of over RMB10 billion in China, 2010-2015
Revenue of the Ranking No.1 among Top 100 Car Dealers in China, 2010-2015
Vehicle Sales Volume of Top 100 Car Dealers in China, 2010-2015
Top 20 Car Dealers by Revenue in China, 2015
Top 20 Car Dealers by Revenue in China, 2014
New Car Sales Volume Comparison between Chinese Car Dealers, 2015
Revenue Comparison between Major Chinese Car Dealers, 2013-2016
Net Income Comparison between Major Chinese Car Dealers, 2013-2016
Automobile Sales Gross Margin of Major Chinese Car Dealers, 2013-2016
After-sales Service Gross Margin of Major Chinese Car Dealers, 2013-2016
Comparison between Major Chinese Car Dealers by Number of 4S Shops, 2015
Layout of Major Chinese Car Dealers in Various Fields
China’s Automobile Output, 2011-2016
China’s Automobile Output Structure (by Type), 2011-2016
China’s Automobile Output, 2016-2020E
China’s Automobile Sales Volume, 2011-2016
China’s Automobile Sales Volume Structure (by Type), 2011-2016
China’s Automobile Sales Volume, 2016-2020E
China’s Automobile Import Volume, 2011-2016
China’s Automobile Import Value, 2011-2016
China’s Automobile Import Structure (by Type), 2011-2016
China’s Automobile Import Unit Price, 2011-2016
China’s Passenger Car Output, 2011-2016
China’s Passenger Car Output, 2016-2020E
China’s Passenger Car Sales Volume, 2011-2016
China’s Passenger Car Sales Volume, 2016-2020E
China’s Passenger Car Sales Volume (by Type), 2011-2016
China’s Passenger Car Sales Volume Structure (by Type), 2011-2016
China’s Passenger Car Import Volume, 2011-2016
China’s Passenger Car Import Value, 2011-2016
China’s Passenger Car Import Unit Price, 2011-2016
China’s Commercial Vehicle Output, 2011-2016
China’s Commercial Vehicle Output, 2016-2020E
China’s Commercial Vehicle Sales Volume, 2011-2016
China’s Commercial Vehicle Sales Volume, 2016-2020E
China’s Commercial Vehicle Sales Volume (by Type), 2011-2016
China’s Commercial Vehicle Sales Volume Structure (by Type), 2011-2016
China’s Commercial Vehicle Import Volume, 2011-2016
China’s Commercial Vehicle Import Value, 2011-2016
China’s Commercial Vehicle Import Unit Price, 2011-2016
China’s New Energy Vehicle (EV&PHEV) Output and Sales Volume, 2011-2016
China’s New Energy Vehicle (EV&PHEV) Sales Volume (by Type), 2015-2016
Policies on China’s New Energy Vehicle Industry, 2009-2016
China’s New Energy Vehicle Sales Volume, 2016-2020E
China’s Used Car Trading Volume, 2015-2020E
Trading Volume Comparison between Used Cars and New Cars in China, 2012-2016
Trading Volume Comparison between Used Cars and New Cars in Major Countries
Development Stages of Used Car Market
Main Trade Modes for Used Cars in China
Trade Modes for Used Cars in Major Countries
Trading Volume and YoY Growth Rate of Used Cars in China, 2011-2016
Proportion of Used Car Trading Volume in China (by Type), 2014-2016
Proportion of Used Car Trading Volume in China (by Service Life), 2015
Proportion of Used Car Trading Volume in China (by Service Life), Jan-Sep 2016
Proportion of Used Car Trading Volume in China (by Price Range), 2015
Proportion of Used Car Trading Volume in China (by Price Range), Jan-Sep 2016
China’s Used Car Trading Volume (by Region), 2015
China’s Used Car Trading Volume (by Region), Jan-Sep 2016
Proportion of Used Car Trading Volume in China (by Region), 2015
Proportion of Used Car Trading Volume in China (by Region), Jan-Sep 2016
Layout of Major Chinese Car Dealers in Used Car Market
Financing of Major Chinese Used Car Trading Service Platforms
China’s Used Car Trading Volume, 2015-2020E
Development Stages of China’s Automotive Finance
Penetration Rate of China’s Automotive Finance, 2015-2020E
Market Size of China’s Automotive Finance Industry, 2014-2020E
Funding Source Structure of Chinese Automotive Finance Market, 2015
Major Automotive Finance Companies in China
Operating Performance of Major Automotive Finance Companies in China, 2015
Market Size of China’s Auto Repair & Beauty Industry, 2012-2020E
Main Financing Cases of Auto Repair & Beauty Industry, 2015-2016
Major Competitors in China’s Auto Repair & Beauty Industry
Major Offline Auto Repair & Beauty Chain Enterprises in China
Comparison between Main Independent Chain Auto Repair & Beauty Brands in China
Some Auto Repair & Beauty Expansion Plans in China
Comparison between Auto Repair & Beauty Channels in China
Number of Merchants in China’s Auto Repair & Beauty Industry by Channel, 2015
Distribution of Auto Repair & Beauty Chain Brands in China’s Key Areas
Distribution of Auto Repair Shops in China, 2015
Distribution of Auto Maintenance & Beauty Shops in China, 2015
Relative Advantages of Network Auto Repair & Beauty
Main Business Models of Internet Platforms for Repair and Maintenance
Some Auto Repair & Beauty Network Platform Projects in China, 2015
Regional Distribution of Auto Repair & Beauty Network Platform Projects in China, 2015
China’s Automotive Insurance Premium Income, 2009-2016
Procurement Model of Pangda Automobile’s 4S Shops
Sales Model of Pangda Automobile’s 4S Shops
Profit Model of Pangda Automobile’s 4S Shops
Revenue and Net Income of Pangda Automobile, 2013-2016
Revenue of Pangda Automobile (by Business), 2014-2016
Revenue Structure of Pangda Automobile (by Business), 2014-2016
Gross Margin of Pangda Automobile, 2014-2016
Gross Margin of Pangda Automobile’s Main Products, 2014-2016
Number of Pangda Automobile’s Business Outlets (by Type), 2010-2016
Vehicle Sales Volume and Inventory of Pangda Automobile, 2015
Top Five Customers of Pangda Automobile, 2013-2015
Core Competitiveness of Pangda Automobile
Revenue and Net Income of Sinomach Automobile, 2013-2016
Revenue of Sinomach Automobile (by Business), 2013-2016
Revenue Structure of Sinomach Automobile (by Business), 2013-2016
Revenue of Sinomach Automobile (by Region), 2013-2016
Gross Margin of Sinomach Automobile (by Business), 2013-2016
Sales Proportion of Imported Automobiles of Sinomach Automobile, 2008-2014
Sales Volume and Inventory of Sinomach Automobile, 2015
Major Cooperative Manufacturers of Zhongsheng Group
Revenue and Net Income of Zhongsheng Group, 2013-2016
Revenue of Zhongsheng Group (by Business), 2013-2016
Revenue Structure of Zhongsheng Group (by Business), 2013-2016
Gross Margin of Zhongsheng Group, 2013-2016
Gross Margin of Zhongsheng Group (by Business), 2013-2015
New Car Sales Volume of Zhongsheng Group
Luxury Brand New Car Sales Volume and % of Total Sales Volume of Zhongsheng Group
Number of Zhongsheng Group’s Outlets (by Region), 2011-2016
Number of Zhongsheng Group’s Outlets (by Grade), 2011-2016
National Layout of Zhongsheng Group, by Jun 2016
Automobile and Automobile-related Business of DCH
Revenue and Net Income of DCH, 2013-2016
Revenue of DCH (by Business), 2013-2016
Revenue Structure of DCH (by Business), 2013-2016
Revenue Structure of DCH (by Region), 2013-2016
Gross Margin of DCH, 2013-2016
Revenue of DCH's Automobile and Automobile-related Business (by Region), 2013-2016
Revenue Structure of DCH's Automobile and Automobile-related Business (by Region), 2013-2016
Automobile Sales Volume of DCH (by Region), 2011-2016
Number of DCH’s 4S Shops, 2011-2016
Number of DCH’s Sales Channels in Mainland China (by Brand), H1 2016
Revenue and Net Income of China Grand Auto, 2014-2016
Revenue of China Grand Auto (by Business), 2015-2016
Gross Margin of China Grand Auto (by Business), 2015-2016
New Car Sales Volume of China Grand Auto, 2014-2016
Number of China Grand Auto’s 4S Shops (by Brand), by June 30, 2016
Revenue and Net Income of Baoxin Auto Group, 2014-2016
Revenue and Net Income of ZhengTong Auto, 2013-2016
Revenue of ZhengTong Auto (by Business), 2013-2016
Revenue Structure of ZhengTong Auto (by Business), 2013-2016
Gross Margin of ZhengTong Auto (by Business), 2013-2016
Number of ZhengTong Auto’s Business Outlets (by Type), by the end of 2015
Newly Opened Business Outlets of ZhengTong Auto, 2015
National Layout of ZhengTong Auto, by the end of 2015
Number of ZhengTong Auto’s Business Outlets (by Type), H1 2016
New Car Sales Volume of ZhengTong Auto (by Brand), 2013-2016
New Car Revenue of ZhengTong Auto (by Brand), 2013-2016
Revenue and Net Income of Grand Orient, 2013-2016
Revenue of Grand Orient (by Business), 2013-2016
Revenue Structure of Grand Orient (by Business), 2013-2016
Gross Margin of Grand Orient, 2013-2016
Distribution of Grand Orient's Opened Stores, 2015
Automobile Revenue of Grand Orient, 2013-2016
Automobile Marketing & Services and Business Model of Grand Orient
Revenue and Gross Profit of Yongda Auto, 2013-2016
Revenue of Yongda Auto (by Business), 2013-2016
Revenue Structure of Yongda Auto (by Business), 2013-2016
Gross Margin of Yongda Auto, 2013-2016
Gross Margin of Yongda Auto (by Business), 2013-2016
Brand Coverage of Yongda Auto, As of June 30, 2016
Number of Outlets of Yongda Auto (by Type), 2015
Passenger Car Sales Volume of Yongda Auto (by Type), 2013-2016
Automotive Finance of Yongda Auto
Revenue and Net Income of Baoxin Auto Group, 2014-2016
Revenue of Baoxin Auto Group (by Business), 2013-2016
Revenue Structure of Baoxin Auto Group (by Business), 2013-2016
Gross Margin of Baoxin Auto Group (by Business), 2013-2016
Automobile Sales Revenue of Baoxin Auto Group (by Brand), 2013-2016
Sales Volume of Baoxin Auto Group (by Type), 2014-2016
Revenue and Net Income of Harmony Auto, 2013-2016
Revenue of Harmony Auto (by Business), 2013-2016
Revenue Structure of Harmony Auto (by Business), 2013-2016
Gross Margin of Harmony Auto (by Business), 2013-2016
New Car Sales Volume of Harmony Auto, 2013-2016
Revenue and Net Income of Yaxia Automobile, 2013-2016
Revenue of Yaxia Automobile (by Business), 2013-2016
Revenue Structure of Yaxia Automobile (by Business), 2013-2016
Gross Margin of Yaxia Automobile (by Business), 2013-2016
Automobile Sales Volume of Yaxia Automobile, 2012-2015
Revenue and Net Income of Materials Industry Zhongda Group Co., Ltd., 2014-2016
Revenue of Materials Industry Zhongda Group Co., Ltd. (by Business), 2014-2016
Vehicle Sales Revenue and % of Total Revenue of Materials Industry Zhongda Group Co., Ltd., 2014-2016
Revenue and Net Income of Zhejiang Materials Industry Yuantong Automobile Group, 2014-2016
如果这份报告不能满足您的要求,我们还可以为您定制报告,请 留言说明您的详细需求。
|