|
|
|
报告导航:研究报告—
金融与服务业—交通物流
|
|
2016-2020年全球及中国第三方物流行业研究报告 |
 |
字数:3.5万 |
页数:122 |
图表数:179 |
|
中文电子版:8000元 |
中文纸版:4000元 |
中文(电子+纸)版:8500元 |
|
英文电子版:2200美元 |
英文纸版:2400美元 |
英文(电子+纸)版:2500美元 |
|
编号:ZHP054
|
发布日期:2017-02 |
附件:下载 |
 |
|
|
由于第三方物流在协助企业完成货物运转的同时,能有效降低物流成本、加快货物周转率,能有效满足企业对物流质量的要求,因此得到快速发展。2015年,全球第三方物流市场规模为7,210亿美元,同比增长4.5%,占物流市场规模的8.2%;2016年市场规模增长约359亿美元,达到7569亿美元。未来凭借高效率、高标准化运作等优势,第三方物流市场规模将稳步提升,预计2020年可突破9,000亿美元,占物流规模的比重接近10.0%。
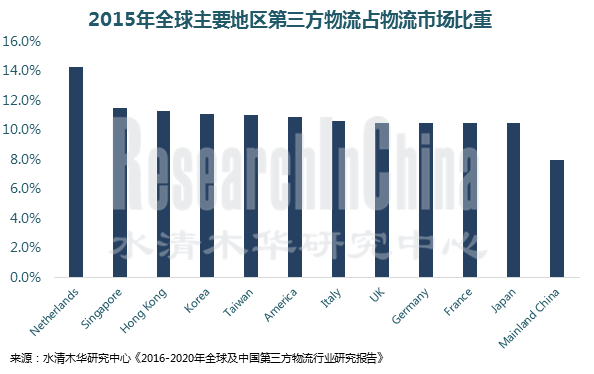
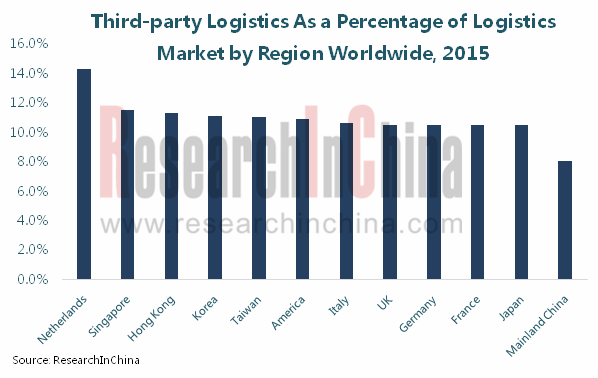
中国是全球最大的第三方物流市场,2015年市场规模为10,652亿元(约1,718亿美元),全球占比23.8%,同比增长13.6%;2016年市场规模在12,000亿元左右。由于中国(大陆)第三方物流产业尚处于初级阶段,在整个物流市场所占的比重与发达国家/地区之间存在一定差距(发达地区占比一般在10.5%以上,中国大陆在8.0%左右),增长空间较大。此外,中国区域贸易的失衡也为第三方物流的快速发展提供了一定的机会。预计2016-2020年,中国第三方物流市场规模的年均复合增长率在15.0%左右。
目前,中国第三方物流产业除了市场占有率不高,还存在需求不足、需求层次低等问题。其中,需求不足主要体现在大部分传统企业对第三方物流的使用相对较少;而需求层次低则主要因为选择第三方物流的企业主要集中于基本常规项目的需求,对增值性高、综合的物流服务需求较少。
从发展趋势看:为了提高盈利能力、使得运营效率最大化,第三方物流将逐渐往规模化、信息化、轻资产化、平台化方向发展。此外,随着中国电商逐渐往一线城市以外的地区发展,第三方物流企业也将逐渐往二、三线城市布局。
从市场竞争格局看,第三方物流市场集中度低,企业之间的竞争十分激烈。2015年全球第三方物流行业CR10不足20.0%,市场规模最大的DHL Supply Chain & Global Forwarding仅为4.1%;而中国最大的第三方物流企业Sinotrans在全球排名第八,市场占有率为1.0%。
水清木华研究中心《2016-2020年全球及中国第三方物流行业研究报告》着重研究了以下内容:
 第三方物流的定义、分类、行业特征、产业链等情况; 第三方物流的定义、分类、行业特征、产业链等情况;
全球及中国物流产业发展概况、运作模式、市场现状、行业特点、发展趋势等情况;
全球第三方物流发展现状、市场规模、市场结构、竞争格局等情况;
中国第三方物流发展概况、发展环境、市场规模、市场结构、竞争格局、存在的问题、发展趋势等情况;
汽车、医药等细分第三方物流市场规模、现状等分析;
基础设施(公路、铁路、水运、航空)、运输装备(载货汽车、铁路货车等)、其他智能物流装备等发展情况;
国外13家、中国9家第三方物流商的经营现状、第三方物流布局等情况。
Third-party logistics can not only help companies complete cargo movement but effectively reduce logistics costs and speed up cargo turnover, fully meeting their requirements on logistics quality. Therefore, third-party logistics develops rapidly. In 2015, global third-party logistics market size hit USD721 billion, a YoY rise of 4.5%, occupying 8.2% of the logistics market size, and increased around USD35.9 billion in 2016, up to USD756.9 billion. In the future, by virtue of high efficiency and highly standardized operation, the third-party logistics market size will grow steadily, expectedly outstripping USD900 billion in 2020, with a share of nearly 10.0% in the logistics market size.
China is the world largest third-party logistics market. In 2015, its market size attained RMB1,065.2 billion or roughly USD171.8 billion (up 13.6% year on year), a 23.8% share in global market, and reached around RMB1,200 billion in 2016. Chinese (Mainland China) third-party logistics industry is still in its infancy, and lags behind the developed countries/regions by share in the whole logistic market (developed regions generally above 10.5%, Mainland China around 8.0%), leaving a large development space. Moreover, China’s regional trade imbalance also creates certain opportunities for the rapid development of third-party logistics. It is predicted that third-party logistics market size in China will see a CAGR of around 15.0% in 2016-2020.
Additionally with not a high market share, Chinese third-party logistics industry also has problems of insufficient demand and low-level demand at present, respectively due to relatively little use of third-party logistics by most traditional companies, and basic and conventional demand of companies which choose third-party logistics and their small demand for high value-added, comprehensive logistics service.
Development trend: to improve profitability and maximize operational efficiency, third-party logistics is heading towards largescale, informatization, asset-light and platform. In addition, as E-commerce in China gradually spreads to regions outside the first tier cities, third-party logistics companies make layout in the second- and third-tier cities accordingly.
Seen from competitive landscape, third-party logistics market has a low concentration rate, and the players compete fiercely. In 2015, CR10 of global third-party logistics industry was less than 20.0%, of which DHL Supply Chain & Global Forwarding with the largest market size only saw 4.1%; Sinotrans, China’s largest third-party logistics company, ranking eighth in the world, only witnessed a market share of 1.0%.
The report highlights the following:
 Overview of third-party logistics, including definition, classification, industry characteristics, industry chain, etc.; Overview of third-party logistics, including definition, classification, industry characteristics, industry chain, etc.;
Overview of global and Chinese logistics industry, including development overview, operation mode, market status, industry characteristics, development trend, etc.;
Overview of global third-party logistics, including development situation, market size, market structure, competitive pattern, etc.;
Overview of Chinese third-party logistics, including development overview, development environment, market size, market structure, competitive pattern, problems, development trend, etc.;
Overview of third-party logistics market segments like automotive and pharmaceutical, including market size, status quo, etc.;
Development of infrastructure (highway, railway, water carriage, aviation), transportation equipment (truck, railway wagon, etc.) and other intelligent logistics equipment;
Overview of 13 foreign, 9 Chinese third-party logistics companies, including operation, third-party logistics layout, etc..
第一章 第三方物流概述
1.1 定义
1.2 分类
1.3 行业壁垒
1.4 行业特征
1.5 产业链
第二章 物流产业
2.1 发展概况
2.2 运作模式
2.3 市场现状
2.3.1 全球
2.3.2 中国
2.4 行业特点
2.5 发展趋势
第三章 全球第三方物流产业
3.1 发展概况
3.2 市场规模
3.3 市场结构
3.4 竞争格局
第四章 中国第三方物流产业
4.1 发展概况
4.2 发展环境
4.2.1 政策环境
4.2.2 经济环境
4.3 市场现状
4.3.1 市场规模
4.3.2 市场结构
4.3.3 竞争格局
4.4 存在的问题
4.5 发展趋势
第五章 细分市场第三方物流
5.1 汽车
5.1.1 汽车产业规模
5.1.2 汽车第三方物流现状
5.2 医药
5.2.1 医药产业规模
5.2.2 医药第三方物流现状
5.3 冷链第三方物流
第六章 第三方物流配套产业
6.1 基础设施建设
6.1.1 公路
6.1.2 铁路
6.1.3 水运
6.1.4 航空
6.2 运输装备产业
6.2.1 载货汽车
6.2.2 铁路货车
6.2.3 水运船舶
6.2.4 运输飞机
6.3 其它装备
6.3.1 AGV
6.3.2 自动化立体仓库
第七章 国外主要第三方物流企业
7.1 DHL
7.1.1 公司简介
7.1.2 经营情况
7.1.3 第三方物流产业布局
7.2 Kuehne + Nagel
7.2.1 公司简介
7.2.2 经营情况
7.2.3 第三方物流产业布局
7.3 DB Schenker
7.3.1 公司简介
7.3.2 经营情况
7.3.3 第三方物流产业布局
7.4 Nippon Express
7.4.1 公司简介
7.4.2 经营情况
7.4.3 第三方物流产业布局
7.5 C.H Robinson
7.5.1 公司简介
7.5.2 经营情况
7.5.3 第三方物流产业布局
7.6 UPS
7.6.1 公司简介
7.6.2 经营情况
7.6.3 第三方物流产业布局
7.7 DSV
7.7.1 公司简介
7.7.2 经营情况
7.7.3 第三方物流产业布局
7.8 CEVA
7.8.1 公司简介
7.8.2 经营情况
7.8.3 第三方物流产业布局
7.9 Expeditors
7.9.1 公司简介
7.9.2 经营情况
7.9.3 第三方物流产业
7.10 其它
7.10.1 Dachser
7.10.2 Panalpina
7.10.3 SNCF
7.10.4 Kintetsu
第八章 中国主要第三方物流企业
8.1 Sinotrans
8.1.1 公司简介
8.1.2 经营情况
8.1.3 第三方物流产业布局
8.2 中远海运物流有限公司
8.2.1 公司简介
8.2.2 第三方物流产业布局
8.3 招商局物流集团有限公司
8.3.1 公司简介
8.3.2 第三方物流产业布局
8.4 中国物资储运总公司
8.4.1 公司简介
8.4.2 主要子公司-中储发展股份有限公司
8.5 北京长久物流股份有限公司
8.5.1 公司简介
8.5.2 经营情况
8.5.3 第三方物流产业布局
8.6 其它
8.6.1 中海集团物流有限公司
8.6.2 天津大田物流有限公司
8.6.3 青岛海尔物流有限公司
8.6.4 安得物流股份有限公司
1. Overview of Third-party Logistics
1.1 Definition
1.2 Classification
1.3 Industry Barriers
1.4 Industry Characteristics
1.5 Industry Chain
2. Logistics Industry
2.1 Development Overview
2.2 Operation Mode
2.3 Market Status
2.3.1 Global
2.3.2 China
2.4 Industry Characteristics
2.5 Development Trend
3. Global Third-party Logistics Industry
3.1 Development Overview
3.2 Market Size
3.3 Market Structure
3.4 Competitive Patten
4. Chinese Third-party Logistics Industry
4.1 Development Overview
4.2 Development Environment
4.2.1 Policy
4.2.2 Economy
4.3 Market Situation
4.3.1 Market Size
4.3.2 Market Structure
4.3.3 Competitive Patten
4.4 Problems
4.5 Development Trend
5. Third-party Logistics Market Segments
5.1 Automobile
5.1.1 Automotive Industry Scale
5.1.2 Status Quo of Third-party Logistics
5.2 Pharmaceutical
5.2.1 Pharmaceutical Industry Scale
5.2.2 Status Quo of Third-party Logistics
5.3 Cold-chain Third-party Logistics
6. Supporting Industries of Third-party Logistics
6.1 Infrastructure Construction
6.1.1 Highway
6.1.2 Railway
6.1.3 Water Transport
6.1.4 Aviation
6.2 Transportation Equipment Industry
6.2.1 Truck
6.2.2 Railway Wagon
6.2.3 Ship
6.2.4 Cargo Plane
6.3 Other Equipment
6.3.1 AGV
6.3.2 Automated Storage and Retrieval System (AS/RS)
7. Foreign Third-party Logistics Companies
7.1 DHL
7.1.1 Profile
7.1.2 Operation
7.1.3 Third-party Logistics Industry Layout
7.2 Kuehne + Nagel
7.2.1 Profile
7.2.2 Operation
7.2.3 Third-party Logistics Industry Layout
7.3 DB Schenker
7.3.1 Profile
7.3.2 Operation
7.3.3 Third-party Logistics Industry Layout
7.4 Nippon Express
7.4.1 Profile
7.4.2 Operation
7.4.3 Third-party Logistics Industry Layout
7.5 C.H Robinson
7.5.1 Profile
7.5.2 Operation
7.5.3 Third-party Logistics Industry Layout
7.6 UPS
7.6.1 Profile
7.6.2 Operation
7.6.3 Third-party Logistics Industry Layout
7.7 DSV
7.7.1 Profile
7.7.2 Operation
7.7.3 Third-party Logistics Industry Layout
7.8 CEVA
7.8.1 Profile
7.8.2 Operation
7.8.3 Third-party Logistics Industry Layout
7.9 Expeditors
7.9.1 Profile
7.9.2 Operation
7.9.3 Third-party Logistics Industry Layout
7.10 Others
7.10.1 Dachser
7.10.2 Panalpina
7.10.3 SNCF
7.10.4 Kintetsu
8. Chinese Third-party Logistics Companies
8.1 Sinotrans
8.1.1 Profile
8.1.2 Operation
8.1.3 Third-party Logistics Industry Layout
8.2 COSCO Shipping Logistics Co., Ltd.
8.2.1 Profile
8.2.2 Third-party Logistics Industry Layout
8.3 China Merchants Logistics Holding Co., Ltd.
8.3.1 Profile
8.3.2 Third-party Logistics Industry Layout
8.4 China National Materials Storage and Transportation Corporation
8.4.1 Profile
8.4.2 Main Subsidiary - CMST Development Co., Ltd.
8.5 Beijing Changjiu Logistics Co., Ltd.
8.5.1 Profile
8.5.2 Operation
8.5.3 Third-party Logistics Industry Layout
8.6 Others
8.6.1 China Shipping Logistics Co., Ltd.
8.6.2 Tianjin DTW Logistics Co., Ltd.
8.6.3 Qingdao Haier Logistics Co., Ltd.
8.6.4 Annto Logistics Co., Ltd.
表:第三方物流提供的服务范围
表:第三方物流企业(按装车货物)分类
表:第三方物流企业分类
表:第三方物流与传统物流的区别
表:第三方物流行业的风险特征
图:第三方物流产业链
图:快递速递模式
图:仓储物流模式
图:普洛斯模式
图:硬件模式特征
图:电子商务模式特征
图:2006-2020年全球物流产业市场规模
图:2015年全球主要地区物流市场规模占GDP的比重
图:2015年全球主要国家物流成本及占GDP的比重
图:2015年全球物流产业(分地区)市场规模构成
图:2015年全球物流产业(分国家)市场规模构成
图:2011-2016年中国物流行业景气度指数
图:中国物流企业类型
图:2006-2020年中国社会物流总额
图:2010-2017年中国社会物流总费用及增速
图:2010/2015年中国(分产品)社会物流总额构成
表:物流行业主要信息技术
图:2010-2020年全球第三方物流占物流规模的比重
图:2015年全球主要地区第三方物流占物流规模的比重
图:2015年全球主要国家或地区第三方物流占物流规模的比重
图:亚太地区第三方物流风险结构
图:2010-2020年全球第三方物流市场规模
图:2007-2020年美国第三方物流市场规模
图:2015年全球第三方物流(分地区)市场规模构成
图:2015年全球第三方物流(分国家)市场规模构成
表:2015年美国第三方物流细分领域产业规模
图:2015年全球第三方物流市场竞争格局
图:2015年美国第三方物流市场竞争格局
表:中国第三方物流企业类型
表:2015-2017年中国第三方物流产业相关政策
图:2014-2025年中国物流行业融资企业地区分布
图:2015年中国主要经济区物流园区状态
图:2011-2020年中国第三方物流销售收入及增速
图:2011-2020年中国第三方物流销售收入全球占比
图:2015年中国第三方物流(分地区)销售收入构成
表:中国主要第三方物流商业务领域
图:2015年中国第三方物流市场竞争格局
表:2016年中国第三方物流企业运输能力
图:2015/2020年中国第三方物流占物流市场比重
表:不同类型的第三方物流对比
图:2010-2020年全球汽车产量
图:2010-2015年全球汽车产量结构
表:2015年全球主要国家汽车产量TOP20
图:2010-2020年全球汽车销量
表:2010-2015年全球主要国家汽车销量TOP10
图:2010-2020年中国汽车销量及增速
图:2010-2016年中国乘用车销量
图:2010-2016年中国商用车销量
表:主要汽车物流业务及其竞争现状
表:中国汽车物流发展历程
表:中国汽车物流企业分类
图:2015年中国主要汽车物流企业主营收入
表:2015年全球主要汽车第三方物流企业
表:全球主要汽车生产商的第三方物流商
图:2011-2020年中国医药产业市场规模
图:2015年中国医院(分地区)医药销售增速
图:2015年中国医药(分渠道)配送费用结构
表:2015年全球主要医药第三方物流企业
表:国内外冷链产业对比
表:中国冷链物流商业模式
图:2011-2017年中国公路总里程及密度
图:2015年中国公路(分等级)总里程构成
图:2010-2020年中国公路货运量
表:2011-2017年中国铁路营业里程及投资
图:2013-2020年中国铁路货运量
图:2011-2016年中国水运建设投资额
图:2010-2020年中国水运货运量
图:2013-2017年中国内河航道通航里程
图:2015年中国内河航道通(分等级)航里程构成
表:2015年中国港口(分吨级)泊位
表:2014-2015年中国万吨级及以上泊位构成
图:2011-2016年中国民用航空机场数量
图:2011-2016年中国航空货邮吞吐量
图:2015年中国航空货邮(分地区)吞吐量
图:2010-2020年中国航空货运量
表:2010-2015年中国载货汽车拥有量
图:2006-2016年中国铁路货车产量及增速
图:2011-2016年中国水上运输船舶保有量
表:2015年中国水上运输船舶构成
表:2010-2016年中国三大航空公司货物运力情况
表:2014-2016年中国民航运输业运输量价指数
图:2012-2020年中国自动化物流装备市场规模
图:2013-2020年中国自动化物流装备系统(分设备)规模结构
图:2011-2020年全球AGV产品新增规模及同比增长
图:2014-2020年中国AGV装机量及同比增长率
图:2013-2020年中国自动化立体仓库市场规模
图:2015年中国自动化立体仓库(分领域)市场规模构成
图:DHL集团分支
表:2014-2016年DHL经营情况
表:2015-2016年DHL(分业务)经营情况
图:2015年DHL(分地区)贸易结构
表:2015年DHL集团第三方物流细分领域客户数量
表:2015年DHL集团Global Forwarding Freight收入及运输量
表:2015年DHL集团Supply Chain收入结构
表:2015-2016年Kuehne + Nagel员工数量分布
图:2014-2016年Kuehne + Nagel经营情况
表:2015-2016年Kuehne + Nagel主要业务经营情况
图:2014-2016年Kuehne + Nagel(分地区)营业收入
图:2014-2016年Kuehne + Nagel第三方物流业务收入
表:2015年Kuehne + Nagel第三方物流细分领域客户数量
表:2015年DB Schenker经营情况
表:DB Schenker运输能力
图:2015年DB Schenker第三方物流细分领域客户数量
图:DB Schenker在华第三方物流布局
图:Nippon Express全球布局
图:2010-2017财年Nippon Express营业收入及净利润
表:2018财年Nippon Express发展规划
表:2015-2016财年Nippon Express(分业务)营业收入
表:2015-2016财年Nippon Express(分地区)营收构成
表:2015年Nippon Express第三方物流细分领域客户数量
图:C.H. Robinson发展历程
图:2011-2015年C.H. Robinson营收及净利润
表:2011-2015年C.H. Robinson(分运输方式)净收入
图:2013-2015年C.H. Robinson(分地区)总收入
表:C.H. Robinson两大信息平台
表:C.H. Robinson主要收购事项
图:2015年C.H. Robinson物流客户行业结构
表:2015年C.H. Robinson第三方物流细分领域客户数量
图:2015年C.H. Robinson物流运力供应商结构
图:UPS业务结构
图:2013-2016年UPS营业收入及净利润
图:2015-2016年UPS(分业务)营业收入构成
图:2015年UPS(分地区)营业收入构成
表:2013-2015年UPS公司Supply Chain & Freight业务运营情况
表:2015年UPS第三方物流细分领域客户数量
图:DSV概况
图:2011-2016年DSV营业收入及利润
图:2015-2016年DSV(分业务)营业收入构成
图:2015年DSV(分地区)营业收入构成
图:DSV与UTi全球布局
表:2015年UTi第三方物流细分领域客户数量
表:2015年DSV第三方物流细分领域客户数量
图:2015年CEVA员工分布
图:2014-2016年CEVA营业收入及利润
图:2015-2016年CEVA(分业务)营业收入构成
图:2015年CEVA(分领域)营业收入构成
图:2015年CEVA(分地区)营业收入构成
图:2014-2016年CEVA第三方物流业务收入
表:2015年CEVA第三方物流细分领域客户数量
图:2011-2016年Expeditors营业收入及利润
图:2015-2016年Expeditors(分业务)营业收入构成
表:2013-2015年Expeditors主要业务经营情况
图:2015年Expeditors(分地区)营业收入构成
图:2013-2015年Expeditors(分地区)净收入
图:2012-2015年Expeditors货运量
图:Sinotrans全球布局
图:2011-2016年Sinotrans销售额及利润
图:2014-2016年Sinotrans(分业务)销售额构成
表:2014-2016年Sinotrans营运数量
图:中远海运物流有限公司全球布局
表:中远海运物流有限公司主要业务
图:招商物流布局
图:招商物流快消品物流服务模式
图:招商物流已实现运输线路图
图:招商物流集约化管理
图:招商物流可视化管理
图:中国储运产业布局
图:2012-2016中国储运物流业务收入
图:2013-2016年中储股份营业收入及净利润
图:2015-2016年中储股份(分业务)营业收入构成
图:2013-2016年长久物流营业收入及净利润
表:2013-2015年长久物流汽车主营业务
表:2015年长久物流乘用车前五大客户
图:长久物流业务布局
图:长久物流业务模式
图:2013-2015年长久物流(分运输方式)收入构成
表:2013-2015年长久物流进口整车运输业务情况
表:2013-2015年长久物流进口整车(分品牌)业务收入
表:2013-2015年长久物流进口大众品牌整车发运量
表:2013-2015年长久物流进口福特品牌整车发运量
表:大田物流货运仓储能力
表:2016年安得物流货运配送能力
图:安得物流自建DC仓库分布
图:安得物流配送中心分布
Service Items of Third-party Logistics
Classification of Third-party Logistics Companies (by Cargo Loaded)
Classification of Third-party Logistics Companies
Difference between Third-party Logistics and Traditional Logistics
Risk Characteristics of Third-party Logistics Industry
Third-party Logistics Industry Chain
Express Delivery Mode
Warehouse Logistics Mode
Prologis Mode
Characteristics of Hardware Mode
Characteristics of E-commerce Mode
Global Logistics Market Size, 2006-2020E
Logistics Market Size as a Percentage of GDP by Region Worldwide, 2015
Logistics Cost as a Percentage of GDP by Country, 2015
Structure of Global Logistics Market Size by Region, 2015
Structure of Global Logistics Market Size by Country, 2015
Climate Index of Chinese Logistics Industry, 2011-2016
Chinese Logistics Companies by Type
Total Social Logistics in China, 2006-2020E
Total Cost of Social Logistics and YoY Growth in China, 2010-2017
Structure of Total Social Logistics in China by Product, 2010/2015
Main Information Technologies of Logistics Industry
Third-party Logistics as a Percentage of Logistics Scale Worldwide, 2010-2020E
Third-party Logistics as a Percentage of Logistics Scale by Region Worldwide, 2015
Third-party Logistics as a Percentage of Logistics Scale by Country/Region Worldwide, 2015
Risk Structure of Third-party Logistics in Asia-Pacific Region
Global Third-party Logistics Market Size, 2010-2020E
Third-party Logistics Market Size in the United States, 2010-2020E
Structure of Global Third-party Logistics Market Size by Region, 2015
Structure of Global Third-party Logistics Market Size by Country, 2015
Industry Scale of Third-party Logistics Segments in United States, 2015
Competitive Pattern of Global Third-party Logistics Market, 2015
Competitive Pattern of Third-party Logistics Market in United States, 2015
Chinese Third-party Logistics Companies by Type
Policies on Third-party Logistics Industry in China, 2015-2017
Regional Distribution of Chinese Financing Companies in Logistics Industry, 2014-2025E
Situation of Logistics Parks in Main Economic Areas in China, 2015
Third-party Logistics Revenue and YoY Growth in China, 2011-2020E
China’s Third-party Logistics Revenue as a Percentage of Global Total, 2011-2020E
Revenue Structure of Third-party Logistics in China by Region, 2015
Business Areas of Main Third-party Logistics Companies in China
Competitive Pattern of Third-party Logistics Market in China, 2015
Transport Capacity of Third-party Logistics Companies in China, 2016
Third-party Logistics as a Percentage of Logistics Market in China, 2015/2020E
Comparison among Different Types of Third-party Logistics
Global Automobile Output, 2010-2020E
Global Automobile Output Structure, 2010-2015
TOP 20 Countries by Automobile Output, 2015
Global Automobile Sales Volume, 2010-2020E
TOP 10 Countries by Automobile Sales Volume, 2010-2015
Automobile Sales Volume and YoY Growth in China, 2010-2020E
Sales Volume of Passenger Vehicles in China, 2010-2016
Sales Volume of Commercial Vehicles in China, 2010-2016
Main Automotive Logistics Businesses and Competition Situation
Development Course of Automotive Logistics in China
Classification of Automotive Logistics Companies in China
Operating Revenue of Main Automotive Logistics Companies in China, 2015
Main Automotive Third-party Logistics Companies Worldwide, 2015
Third-party Logistics Firms of Main Automakers Worldwide
Pharmaceutical Market Size in China, 2011-2020E
Growth Rate of Pharmaceutical Sales of Hospitals in China by Region, 2015
Cost Structure of Pharmaceutical Distribution in China by Channel, 2015
Main Pharmaceutical Third-party Logistics Companies Worldwide, 2015
Comparison between Chinese and Foreign Cold-chain Logistics Industry
Business Model of Cold-chain Logistics in China
Total Mileage and Density of Highways in China, 2011-2017
Structure of Total Mileage of Highways in China by Grade, 2015
Highway Freight Volume in China, 2010-2020E
Operating Mileage and Investment of Railways in China, 2011-2017
Railway Freight Volume in China, 2013-2020E
Water Transport Construction Investment in China, 2011-2016
Water Freight Volume, 2010-2020E
Navigable Length of Inland Waterways in China, 2013-2017
Structure of Navigable Length of Inland Waterways in China by Grade, 2015
Berthsof Ports in China by Tonnage, 2015
Berth (≥10kt) Structure in China, 2014-2015
Number of Civil Aviation Airports in China, 2011-2016
Air Cargo and Mail Throughput in China, 2011-2016
Air Cargo and Mail Throughput in China by Region, 2015
Air Freight Volume in China, 2010-2020E
Ownership of Trucks in China, 2010-2015
Output of Railway Wagons and YoY Growth in China, 2006-2016
Ownership of Ships for Water Transport in China, 2011-2016
Structure of Ships for Water Transport in China, 2015
Cargo Capacity of Three Major Airlines in China, 2010-2016
Transport Capacity Pricing Index of Civil Aviation Transportation in China, 2014-2016
Automated Logistics Equipment Market Size in China, 2012-2020E
Market Size Structure of Automated Logistics Equipment System in China by Equipment, 2013-2020E
New Automated Guided Vehicle (AGV) Products and YoY Growth Worldwide, 2011-2020E
Automated Guided Vehicle (AGV) Installs and YoY Growth in China, 2014-2020E
Automated Storage and Retrieval System (AS/RS) Market Size in China, 2013-2020E
Structure of Automated Storage and Retrieval System (AS/RS) Market Size in China by Sector, 2015
Branches of DHL
Operation of DHL, 2014-2016
Operation of DHL by Business, 2015-2016
Trade Structure of DHL by Region, 2015
Number of Clients of DHL in Third-party Logistics Segments, 2015
Revenue and Freight Volume of Global Forwarding Freight of DHL, 2015
Supply Chain Revenue Structure of DHL, 2015
Distribution of Employees of Kuehne + Nagel by Number, 2015-2016
Operation of Kuehne + Nagel, 2014-2016
Operation of Kuehne + Nagel by Business, 2015-2016
Revenue of Kuehne + Nagel by Region, 2014-2016
Kuehne + Nagel’s Revenue from Third-party Logistics Business, 2014-2016
Number of Clients of Kuehne + Nagel in Third-party Logistics Segments, 2015
Operation of DB Schenker, 2015
Transport Capacity of DB Schenker, 2015
Number of Clients of DB Schenker in Third-party Logistics Segments, 2015
Third-party Logistics Layout of DB Schenker in China
Global Presence of Nippon Express
Revenue and Net Income of Nippon Express, FY2010-FY2017
Development Plan of Nippon Express, FY2018
Revenue of Nippon Express by Business, FY2015-FY2016
Revenue Structure of Nippon Express by Region, FY2015-FY2016
Number of Clients of Nippon Express in Third-party Logistics Segments, 2015
Development Course of C.H. Robinson
Revenue and Net Income of C.H. Robinson, 2011-2015
Net Revenue of C.H. Robinson by Mode of Transport, 2011-2015
Total Revenue of C.H. Robinson by Region, 2013-2015
Two Information Platforms of C.H. Robinson
Major M&As of C.H. Robinson
Industry Structure of Logistics Clients of C.H. Robinson, 2015
Number of Clients of C.H. Robinson in Third-party Logistics Segments, 2015
Suppliers of C.H. Robinson by Logistics Capacity, 2015
Business Structure of UPS
Revenue and Net Income of UPS, 2013-2016
Revenue Structure of UPS by Business, 2015-2016
Revenue Structure of UPS by Region, 2015
Operation of Supply Chain & Freight Business of UPS, 2013-2015
Number of Clients of UPS in Third-party Logistics Segments, 2015
Overview of DSV
Revenue and Net Income of DSV, 2011-2016
Revenue Structure of DSV by Business, 2015-2016
Revenue Structure of DSV by Region, 2015
Global Presence of DSV and UTi
Number of Clients of UTi in Third-party Logistics Segments, 2015
Number of Clients of DSV in Third-party Logistics Segments, 2015
Distribution of CEVA’s Employees, 2015
Revenue and Net Income of CEVA, 2014-2016
Revenue Structure of CEVA by Business, 2015-2016
Revenue Structure of CEVA by Sector, 2015
Revenue Structure of CEVA by Region, 2015
CEVA’s Revenue from Third-party Logistics Business, 2014-2016
Number of Clients of CEVA in Third-party Logistics Segments, 2015
Revenue and Net Income of Expeditors, 2011-2016
Revenue Structure of Expeditors by Business, 2015-2016
Operation of Main Businesses of Expeditors, 2013-2015
Revenue Structure of Expeditors by Region, 2015
Net Revenue of Expeditors by Region, 2013-2015
Freight Volume of Expeditors, 2012-2015
Global Presence of Sinotrans
Revenue and Profits of Sinotrans, 2011-2016
Revenue Structure of Sinotrans by Business, 2014-2016
Logistics Operations of Sinotrans, 2014-2016
Global Presence of COSCO Shipping Logistics Co., Ltd.
Main Businesses of COSCO Shipping Logistics Co., Ltd.
Layout of China Merchants Logistics Holding Co., Ltd.
Fast Moving Consumer Goods (FMCG) Logistics Service Mode of China Merchants Logistics Holding Co., Ltd.
Established Transport Routes of China Merchants Logistics Holding Co., Ltd.
Intensive Management of China Merchants Logistics Holding Co., Ltd.
Visual Management of China Merchants Logistics Holding Co., Ltd.
Industrial Layout of China National Materials Storage and Transportation Corporation
China National Materials Storage and Transportation Corporation’s Revenue from Logistics Business, 2012-2016
Revenue and Net Income of CMST Development Co., Ltd., 2013-2016
Revenue Structure of CMST Development Co., Ltd. by Business, 2015-2016
Revenue and Net Income of Beijing Changjiu Logistics Co., Ltd., 2013-2016
Operating Automotive Business of Beijing Changjiu Logistics Co., Ltd., 2013-2015
Top 5 Passenger Vehicle Clients of Beijing Changjiu Logistics Co., Ltd., 2015
Business Layout of Beijing Changjiu Logistics Co., Ltd.
Business Mode of Beijing Changjiu Logistics Co., Ltd.
Revenue Structure of Beijing Changjiu Logistics Co., Ltd. by Mode of Transport, 2013-2015
Imported Complete Vehicle Transport Operation of Beijing Changjiu Logistics Co., Ltd., 2013-2015
Beijing Changjiu Logistics Co., Ltd.’s Revenue from Imported Complete Vehicle Transport Operation by Brand, 2013-2015
Shipments of Imported VW Brand Cars of Beijing Changjiu Logistics Co., Ltd., 2013-2015
Shipments of Imported Ford Brand Cars of Beijing Changjiu Logistics Co., Ltd., 2013-2015
Freight and Storage Capacity of Tianjin DTW Logistics Co., Ltd.
Freight and Distribution Capacity of Annto Logistics Co., Ltd., 2016
Presence of Self-built Distribution Center (DC) Warehouses of Annto Logistics Co., Ltd.
Presence of Distribution Centers (DC) of Annto Logistics Co., Ltd.
如果这份报告不能满足您的要求,我们还可以为您定制报告,请 留言说明您的详细需求。
|