|
|
|
报告导航:研究报告—
TMT产业—TMT其他
|
|
2017-2021年全球及中国动漫行业研究报告 |
 |
字数:6.6万 |
页数:160 |
图表数:186 |
|
中文电子版:8000元 |
中文纸版:4000元 |
中文(电子+纸)版:8500元 |
|
英文电子版:2700美元 |
英文纸版:2900美元 |
英文(电子+纸)版:3000美元 |
|
编号:ZHP058
|
发布日期:2017-04 |
附件:下载 |
 |
|
|
2016年,全球动漫行业总产值在2,200亿美元左右。其中,美国是全球产值最大的国家,2016年市场份额约38%,主要以动画电影大片带动整个产业链的发展;日本动漫产值市场占比低于美国,2016年约10%,但产品数量大,全球60%左右动漫作品来自日本。
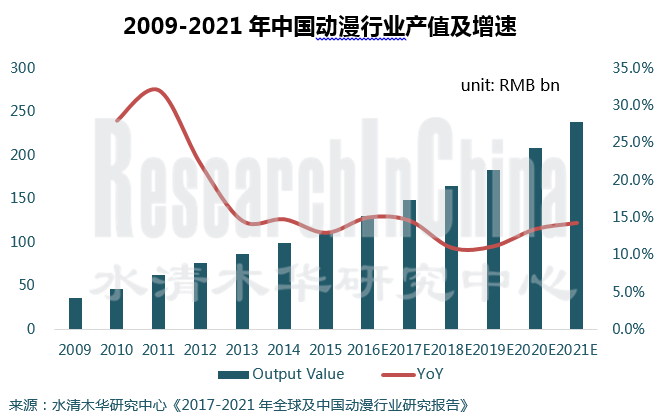
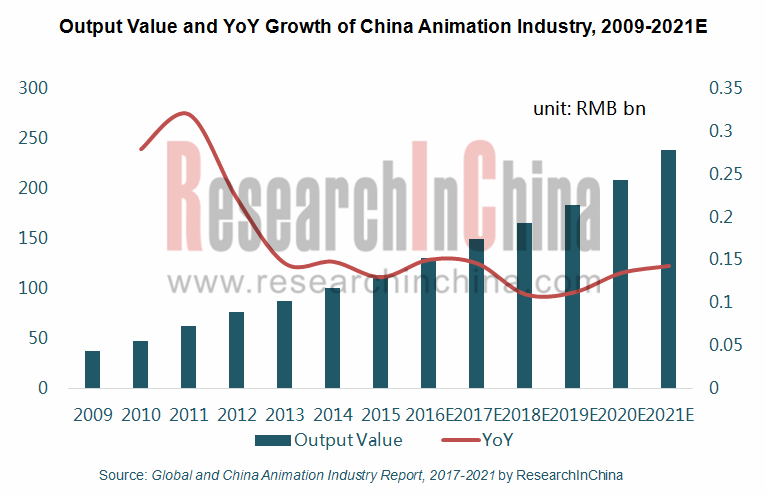
中国动漫产业起步较晚,与美、日等发达国家还存在一定的差异。2016年中国动漫行业产值约1,300亿元(全球占比在8%左右),同比增长15.0%。未来随着动漫IP化运营日益显著,动画电影不断渗透,动漫行业产值将不断增大,预计2017年产值达到1,500亿元左右,2021年可突破2,300亿元。
2015年以来,中国动漫实现平稳增长,市场发展特点如下:
一、作品质量不断提高
2015年的《西游记之大圣归来》收获近10亿元的票房,成为中国影史上票房最高的动画电影;2016年的《大鱼海棠》累计票房也突破5亿元,中外合拍的《功夫熊猫3》累计票房则突破10亿元。
二、电影动画、新媒体动画成为行业热点
2016年,中国立项动画电影182部,完成60部,上映39部,累计实现票房收入23.5亿元,同比增长15.2%,占中国动画电影市场收入的34.1%。
此外,网络动漫也出现快速增长。例如,截止2016年漫画网站有妖气已聚集1.4万个草根漫画作者或团体,刊载网络漫画4万多部。
三、投融资市场活跃
2016年共有15家动漫领域的创业公司获得融资,以花火文化、可为互娱、快乐工场、云端漫画等为代表的集动画制作、IP衍生等为一体的综合性公司为主,其中花火文化成功融资4,000万人民币,投资方包括秀强股份、弘图广电、映趣资本等多家公司。
四、中外合作程度加深
2015年以来,中国动漫企业与国外的合作日益频繁。2015年,光线传媒与日本通耀公司成立合资公司,共同开发人气动漫影视作品,乐视影视与《狮子王》导演合作开发《狼图腾》动画电影;2016年东方梦工厂与梦工厂动画合作拍摄《功夫熊猫3》;2017年,新浪动漫与法国Delitoon公司合作出版法国版《滚蛋吧!肿瘤君》漫画。
水清木华研究中心《2017-2021年全球及中国动漫行业研究报告》着重研究了以下内容:
 动漫产业的定义、产业链、经营模式、发展特点等情况; 动漫产业的定义、产业链、经营模式、发展特点等情况;
全球及细分市场(美国、日本、韩国)动漫产业政策、产业现状、市场规模等情况;
中国动漫行业发展环境、市场规模、竞争格局、产业基地等情况;
中国动漫制作和传播发行市场(电视动画、动画电影、动漫游戏、新媒体动漫)市场规模、市场结构、发展趋势等情况;
中国动漫衍生品(动漫玩具、动漫服饰、主题乐园、品牌授权)市场规模、市场格局等情况;
国外8家、中国10家动漫相关企业的经营情况、发展战略等情况。
In 2016, the global animation industry recorded output value of approximately USD220 billion, of which, the United States made the greatest contribution and claimed about 38% market share, with animated blockbusters boosting the development of the whole industry chain; Japan gained roughly 10% share but a large number of products – about 60% of the world’s animation works come from Japan.
China’s animation industry started relatively late, still lagging behind the United States, Japan and other developed countries. In 2016, China’s animation industry output value reached around RMB130 billion (with a global share of 8% or so), up 15.0% year on year. In the future, with the increasingly significant animation intellectual property (IP) operations and continuous permeation of animated films, output value of animation industry will keep expanding, with an expected RMB150 billion in 2017 and more than RMB230 billion in 2021.
The Chinese animation industry has seen steady growth since 2015, with market characterizing the following:
1. The Improving Quality of Works
In 2015, ‘Monkey King: Hero Is Back’ gained the box office of nearly RMB1 billion and became the highest-grossing animated film in the history of Chinese film. In 2016, Big Fish & Begonia recorded more than RMB500 million at the box office, and the Sino-foreign co-produced Kung Fu Panda 3 exceeded RMB1 billion.
2. Film Animation and New Media Animation Become Hot Spots
In 2016, China approved 182 animated films, completed 60 ones and released 39 ones, with cumulative box office returns of RMB2.35 billion, up 15.2% year on year, accounting for 34.1% of China’s animation film market revenue.
In addition, online comics are growing fast, e.g. the comic platform u17.com has gathered 14,000 grassroots comic authors or groups and published over 40,000 online comics as of 2016.
3. Investment and Financing Market is Active
In 2016, 15 anime startups obtained financing. They are mainly companies that integrate animation production, IP derivatization, etc., represented by Fireworks Culture, Canwell and JoyWorks. Among them, Fireworks Culture got RMB40 million financing from Jiangsu Xiuqiang Glasswork Co., Ltd., Shanghai Delight Capital Management Co., Ltd. and other companies.
4. Sino-foreign Cooperation Deepens
Chinese animation enterprises have established increasing cooperation with foreign peers since 2015. In 2015, Enlight Media and Japan’s Access Bright set up a joint venture on co-development of popular animation film and television works; LeTV and the director of The Lion King developed The Wolf Totem animated film. In 2016, Oriental DreamWorks and DreamWorks Animation together shot Kung Fu Panda 3. In 2017, Sina Comic and the France-based Delitoon co-published Go Away Mr Tumour (French version) cartoon.
The report highlights the following:
 Definition, industry chain, business model, development characteristics, etc. of animation industry; Definition, industry chain, business model, development characteristics, etc. of animation industry;
Animation industry policy, industry status, scale, etc. of global and segmented markets (USA, Japan, Korea);
Development environment, market size, competition pattern, industrial base, etc. of China’s animation industry;
Scale, structure, trends, etc. of China’s animation production, communication and distribution markets (TV animation, animated film, anime games, new media animation);
Scale, pattern, etc. of China’s derivatives market (animation toys, animation clothing, theme park, brand licensing);
Operation, development strategy, etc. of 8 foreign and 10 Chinese animation related enterprises.
第一章动漫行业的基本介绍
1.1 定义
1.2 产业链
1.3 经营模式
1.4 经济特性
1.5 发展特点
第二章全球动漫行业发展概况
2.1 整体发展
2.1.1 扶持政策
2.1.2 产业现状
2.2 美国
2.2.1 产业概况
2.2.2 发展历程
2.2.3 产业链分析
2.3 日本
2.3.1 产业概况
2.3.2 发展历程
2.3.3 产业链分析
2.3.4 制作成本
2.4 韩国
第三章中国动漫行业发展概况
3.1 发展环境
3.1.1 政策环境
3.1.2 产业环境
3.2 市场规模
3.2.1 产值
3.2.2用户规模
3.3 动漫企业分析
3.3.1 主要参与者
3.3.2 制作型公司
3.3.3 媒体型公司
3.3.4 整合运营型公司
3.4 竞争格局
3.4.1 海外企业在华布局
3.4.2 资本关注度
3.5 动漫产业基地
第四章中国动漫制作和传播发行市场
4.1 电视动画
4.1.1 规模
4.1.1 结构
4.2 动画电影
4.2.1 规模
4.2.1 格局
4.3 动漫游戏
4.4 漫画
4.5 新媒体市场
4.5.1 概述
4.5.2 特征
4.5.3 盈利模式
4.5.4 产业主体
4.5.5 市场需求
4.5.6 市场规模
4.5.7 发展趋势
第五章中国动漫衍生产业分析
5.1 整体概述
5.2 动漫玩具
5.2.1 规模
5.2.2 格局
5.3 动漫服饰
5.3.1 规模
5.3.2 格局
5.3.3 企业
5.4 主题公园
5.4.1 概述
5.4.2 主要企业
5.5 品牌授权
5.5.1 市场规模
5.5.2 发展特点及存在的问题
5.5.3 发展趋势
第六章国外动漫行业重点企业分析
6.1 Disney
6.1.1 公司简介
6.1.2 主要业务
6.1.3 发展历程
6.1.4 经营状况
6.1.5 业务模式
6.1.6 竞争优势
6.2 Bandai Namco Group
6.2.1 公司简介
6.2.2 发展历程
6.2.3 经营状况
6.2.4 发展战略
6.3 Hasbro
6.3.1 公司简介
6.3.2 发展历程
6.3.3 品牌介绍
6.3.4 经营状况
6.3.5 发展规划
6.4 Toei Animation
6.4.1 公司简介
6.4.2 发展历程
6.4.3 经营状况
6.5 其它
6.5.1 DreamWorks
6.5.2 Pixar Animation
6.5.3 Sotsu
6.5.4 吉卜力工作室
第七章中国动漫行业重点分析
7.1 奥飞娱乐
7.1.1 公司简介
7.1.2 发展历程
7.1.3 经营状况
7.1.4 研发投入
7.1.5 竞争优势
7.1.6 战略布局
7.1.7 业绩预测
7.2 美盛文化
7.2.1 公司简介
7.2.2 发展历程
7.2.3 产品介绍
7.2.4 经营状况
7.2.5 发展战略
7.2.6 业绩预测
7.3 骅威文化
7.3.1 公司简介
7.3.2 发展历程
7.3.3 经营状况
7.3.4 研发投入
7.3.5 发展战略
7.3.6 业绩预测
7.4 华强方特
7.4.1 公司简介
7.4.2 经营情况
7.4.3 业务介绍
7.4.4 发展战略
7.5 淘米网络
7.5.1 公司简介
7.5.2 发展历程
7.5.3 业务介绍
7.6 中南卡通
7.6.1 公司简介
7.6.2 经营状况
7.6.3 主要客户及供应商
7.6.4 研发投入
7.6.5 发展战略
7.7 其他
7.7.1 炫动传播
7.7.2 腾讯动漫
7.7.3 央视动画
7.7.4 优扬传媒
第八章总结与预测
8.1 总结
8.2 预测
8.2.1 驱动因素
8.2.2 产值预测
1 Overview of Animation Industry
1.1 Definition
1.2 Industrial Chain
1.3 Business Model
1.4 Economic Characteristics
1.5 Development Features
2 Global Animation Industry Development
2.1 Overview
2.1.1 Support Policy
2.1.2 Industry Status
2.2 United States
2.2.1 Overview
2.2.2 Development History
2.2.3 Industrial Chain
2.3 Japan
2.3.1 Overview
2.3.2 Development History
2.3.3 Industrial Chain
2.3.4 Production Cost
2.4 South Korea
3 China Animation Industry Development
3.1 Development Environment
3.1.1 Policy Environment
3.1.2 Industry Environment
3.2 Market Size
3.2.1 Output Value
3.2.2 User Scale
3.3 Animation Enterprises
3.3.1 Major Participants
3.3.2 Production Type
3.3.3 Media Type
3.3.4 Integrated Operation Type
3.4 Competition Pattern
3.4.1 Foreign Enterprises’ Layout in China
3.4.2 Capital Interest
3.5 Animation Industry Base
4 China Animation Production & Distribution Market
4.1 TV Animation
4.1.1 Scale
4.1.2 Structure
4.2 Animated Film
4.2.1 Scale
4.2.2 Pattern
4.3 Cartoon Game
4.4 Comics
4.5 New Media Market
4.5.1 Overview
4.5.2 Characteristics
4.5.3 Profit Model
4.5.4 Industrial Subject
4.5.5 Market Demand
4.5.6 Market Size
4.5.7 Trends
5 China Animation Derivative Industry
5.1 Overview
5.2 Animation Toy
5.2.1 Scale
5.2.2 Pattern
5.3 Animation Apparel
5.3.1 Scale
5.3.2 Pattern
5.3.3 Enterprise
5.4 Theme Park
5.4.1 Overview
5.4.2 Enterprise
5.5 Brand Licensing
5.5.1 Scale
5.5.2 Development Characteristics and Problems
5.5.3 Trends
6 Key Enterprises in Foreign Animation Industry
6.1 Disney
6.1.1 Profile
6.1.2 Main Business
6.1.3 Development History
6.1.4 Operation
6.1.5 Business Model
6.1.6 Competitive Advantage
6.2 Bandai Namco Group
6.2.1 Profile
6.2.2 Development History
6.2.3 Operation
6.2.4 Development Strategy
6.3 Hasbro
6.3.1 Profile
6.3.2 Development History
6.3.3 Brand Introduction
6.3.4 Operation
6.3.5 Development Planning
6.4 Toei Animation
6.4.1 Profile
6.4.2 Development History
6.4.3 Operation
6.5 Others
6.5.1 DreamWorks
6.5.2 Pixar Animation
6.5.3 Sotsu
6.5.4 Studio Ghibli
7 Key Enterprises in Chinese Animation Industry
7.1 Guangdong Alpha Animation And Culture Co., Ltd.
7.1.1 Profile
7.1.2 Development History
7.1.3 Operation
7.1.4 R&D Input
7.1.5 Competitive Advantage
7.1.6 Strategic Layout
7.1.7 Earnings Estimate
7.2 Meisheng Cultural & Creative Corp., Ltd.
7.2.1 Profile
7.2.2 Development History
7.2.3 Products
7.2.4 Operation
7.2.5 Development Strategy
7.2.6 Earnings Estimate
7.3 Huawei Culture Co., Ltd.
7.3.1 Profile
7.3.2 Development History
7.3.3 Operation
7.3.4 R&D Input
7.3.5 Development Strategy
7.3.6 Earnings Estimate
7.4 Fantawild Holdings Inc.
7.4.1 Profile
7.4.2 Operation
7.4.3 Business
7.4.4 Development Strategy
7.5 Taomee Holdings Limited
7.5.1 Profile
7.5.2 Development History
7.5.3 Business
7.6 Zhejiang Zoland Animation Co., Ltd.
7.6.1 Profile
7.6.2 Operation
7.6.3 Customers & Suppliers
7.6.4 R&D Input
7.6.5 Development Strategy
7.7 Others
7.7.1 Toonmax Media
7.7.2 Tencent Animation
7.7.3 CCTV Animation
7.7.4 Uyoung Media
8 Summary and Forecast
8.1 Summary
8.2 Forecast
8.2.1 Driving Factor
8.2.2 Output Value Forecast
图:动漫产业链
图:动漫产业经营模式
表:“产业文化化”与“文化产业化”两种模式之特点
表:美国及日本经典动漫形象蕴含的主题
表:经典动漫形象的播出情况
图:动漫产业关联效应
表:发达国家动漫产业扶持政策及效果
图:国外动漫产业扶持方法
图:全球动漫产业三大梯队
表:主要国家动漫产业发展对比
表:美国动漫产业发展历程
图:2000-2016年美国动漫电影上映数量
图:美国的动漫产业链
图:美国主要动漫工作室制作成本
表:2015年全球主要动漫公司授权规模
图:2002-2017年日本动漫市场规模
图:2002-2017年日本动漫产业海外收入及占比
图:2007-2016年日本广义动漫市场结构
图:2007-2016年日本狭义动漫市场结构
图:2002-2015年日本儿童家庭动漫和深夜电视动漫制作时长
图:2000-2015年日本院线动漫票房收入
图:2000-2015年日本院线动漫作品数量及生产分钟数
图:2000-2015年日本Animation videograms收入
图:2002-2015年日本Animation distribution via the Internet收入
图:日本动漫工作室分布
表:日本动漫产业发展历程
图:日本动漫产业链
图:日本动漫产业投资链条
表:2017年日本动画公司中期制作(分流程)价格
表:2010-2015年韩国主要动漫及衍生品出口规模
表:中国动漫产业的扶持政策
图:2016年中国居民消费支出结构
图:2013-2016年中国文化娱乐产业投资规模
图:2009-2021年中国动漫产业总值及增速
图:2013-2017年中国二次元用户规模
图:2016年中国动漫企业分布
图:动漫产业参与者
表:中国动漫产业链主要代表公司
表:2007-2016年中国国内市场主要动漫形象及出品公司
表:中国动漫行业政府补贴情况
表2015/2017年中国动画制作成本
表:中国国内六大动漫卫视频道对比
表:中国动漫衍生品主要上市公司介绍
表:2014-2016年中国主要动漫衍生品企业营业收入与净利润
表:2014-2016年中国主要动漫衍生品企业营业收入与净利润增长
表:海外动漫企业在华布局
图:2016年中国动漫内容消费市场结构
图:2008-2016年中国国内动漫公司融资数量
表:2016年中国动漫行业融资情况
表:中国动漫产业基地的三种类型
表:中国动漫产业基地名录
表:中国动漫产业基地的运作模式
图:2010-2017年中国国产动画片数量
图:2007-2021年中国国产动画片时长
图:2016年中国电视动画(分题材)数量构成
图:2016年中国电视动画(分题材)时长构成
图:2011-2016年中国电视动画播出时长
表:2015年中国电视动画进出口
图:2008-2021年中国动画电影产量
图:2012-2017年中国动画电影放映场次
图:2012-2017年中国动画电影观影人次
图:2008-2017年中国动画电影上映数量
图:2008-2017年中国动画电影市场票房收入
图:2008-2021年中国国产动画电影票房收入占动画电影总票房收入的比例
图:2010-2017年中国票房超过5000万国产动画数量
图:2016年中国动画电影地区结构
图:2011-2021年中国网络游戏市场规模
图:2011-2017年中国网络游戏市场规模结构
图:2015-2021年中国漫画读者数量
表:腾讯动漫频道人气榜TOP10国产漫画作品
表:中国漫画内容付费模式
图:动漫的新媒体发行渠道
表:中国主流独立动漫网站介绍
图:中国人口各年龄阶段智能手机的持有状况
图:2016年网络动画(分年龄段)覆盖率
图:2013-2021年中国互联网漫画用户规模
图:2009-2021年中国动漫衍生品市场规模
图:2016/2021年中国动漫衍生品细分市场份额
图:2009-2021年中国动漫玩具市场规模及同比增长
图:2016年中国动漫玩具市场竞争格局
图:2009-2021年中国动漫服饰市场规模
图:2016年中国动漫服饰供应结构
图:2016年中国出口动漫服饰占出口目的地消费额的比例
表:中国国内主要动漫服饰企业情况
图:全球迪士尼乐园分布
表:上海迪士尼客流量
图:深圳华强集团主题公园系列
图:2014-2021年中国动漫品牌授权市场规模
图:2015年中国品牌授权市场结构
表:迪士尼公司概况
表:迪斯尼公司主要业务介绍
图:迪士尼公司全球业务分布
表:迪士尼公司发展历程
图:2012-2016财年迪士尼公司主要财务指标
图:2014-2016财年迪士尼公司(分业务)营业收入及利润
图:2014-2016财年迪士尼公司(分地区)营业收入构成
图:迪士尼动漫业务架构
Value Chain of Disney Brand
Industry Structure of Disney Brand
Business Model of Disney
图:Bandai Namco Group主要业务单元
图:Bandai Namco Group业务模式
表:Bandai Namco Group发展阶段
表:Bandai Namco Group大事件
图:2011-2016财年Bandai Namco Group主要财务指标
图:2015-2016财年Bandai Namco Group(分业务)营业收入和营业利润
图:2017财年Bandai Namco Group发展计划
图:2016财年Bandai Namco Group(分地区)营业收入构成
图:Bandai Namco Group中期发展规划
图:Bandai Namco Group发展目标
图:孩之宝介绍
图:孩之宝业务产业链
表:孩之宝发展历程
图:孩之宝品牌发展阶段
图:孩之宝品牌介绍
图:2012-2016年孩之宝主要财务指标
图:2014-2016年孩之宝(分产品)营业收入
图:2014-2016年孩之宝(分业务)营业收入
图:孩之宝品牌化规划
图:孩之宝重点推广品牌
图:Toei Animation业务介绍
图:Toei Animation全球业务分布
表:Toei Animation发展历程
图:东映动画动漫形象创作流程
图:2011-2015财年Toei Animation(分业务)收入
图:2011-2015财年Toei Animation细分市场营收情况
表:2011-2015财年Toei Animation(分地区)收入
表:1998-2016年梦工厂主要电影票房情况
表:Pixar Animation Studios发展历程
表:皮克斯主要动漫电影票房情况
表:2017-2019年皮克斯计划上映影片
图:Sotsu基本信息
表:Sotsu主要业务介绍
表:Sotsu发展历程
图:2012-2017财年Sotsu营业收入与利润
表:吉卜力工作室主要动漫作品票房情况
表:2011-2017年奥飞娱乐发展历程
图:2009-2016年奥飞娱乐营业收入与净利润
图:2010-2016年奥飞娱乐(分业务)营业收入构成
图:2014-2015年奥飞娱乐动漫玩具产销量
图:2006-2016年奥飞娱乐(分区域)营业收入构成
图:2010-2016年奥飞娱乐(分业务)毛利率
图:2011-2016年奥飞娱乐研发投入及占营业收入的比例
表:奥飞娱乐业务产业链发展历程
表:2010-2017年奥飞娱乐资本布局
表:2016-2018年奥飞娱乐营业收入与净利润预测
表:美盛文化发展历程
表:美盛文化服饰系列产品
图:2010-2016年美盛文化营业收入与净利润
图:20015-2016年美盛文化(分业务)营业收入构成
图:2009-2016年美盛文化(分区域)营业收入构成
表:2016年美盛文化主要子公司运营数据
表:2016-2018年美盛文化营业收入与净利润预测
表:骅威文化发展历程
图:2009-2016年骅威文化营业收入与净利润
图:2014-2016年骅威文化(分业务)营业收入构成
图:2010-2016年骅威文化(分区域)营业收入构成
表:2016年上半年骅威文化主要子公司运营数据
图:2009-2016年骅威文化研发费用及占营业收入的比例
表:2016-2018年骅威文化营业收入与净利润预测
图:华强方特产业基地
图:2014-2016年华强方特营业收入及净利润
图:2014-2016年华强方特(分业务)营业收入构成
表:2015年华强方特前六大客户
表:2015年华强方特前五大供应商
图:华强方特国内主题公园分布
表:华强方特文化内容产品及服务介绍
图:华强方特发展规划
表:淘米网络发展历程
表:淘米网络主要业务
图:中南卡通主要合作伙伴
图:2013-2016年中南卡通营业收入及净利润
表:2013-2014年中南卡通(分业务)营业收入和毛利率
表:2015年中南卡通前五大客户收入及占营业收入的比例
表:2015年中南卡通前五大供应商
图:2013-2016年中南卡通研发费用及占营业收入的比例
图:炫动传播业务架构
图:炫动传播合作伙伴
表:央视动画公司发展概况
表:优扬传媒发展历程
图:优扬传媒主营业务
表:优扬传媒主要IP作品
表:动漫产品传播渠道对比分析
图:1949-2016年中国城镇化率
图:1949-2016年中国人口出生率
图:2017-2021年中国动漫行业产值
Industrial Chain of Animation Industry
Business Model of Animation Industry
Characteristics of "Industrial Culturalization" and "Cultural Industrialization”
Themes Contained in U.S. and Japanese Classic Animated Images
Broadcasting of Classic Animated Images
Correlation Effects of Animation Industry
Animation Industry Support Policies and Effects in Developed Countries
Support Measures of Foreign Animation Industry
Three Echelons of Global Animation Industry
A Comparison on Animation Industry Development among Major Countries
Development History of U.S. Animation Industry
Number of Animated Films Released in the United States, 2000-2016
U.S. Animation Industry Chain
Production Costs of Major U.S. Animation Studios
Authorization Scale of Major Global Animation Companies, 2015
Japan’s Animation Market Size, 2002-2017
Overseas Revenue of Japan’s Animation Industry and Proportion, 2002-2017
Japan’s Animation Market Structure in A Broad Sense, 2007-2016
Japan’s Animation Market Structure in A Narrow Sense, 2007-2016
Production Duration of Kid/Family Animation and Late-night TV Animation in Japan, 2002-2015
Box Office Earnings of Theatrical Animation in Japan, 2000-2015
Number of Theatrical Animation Works and Their Production Minutes in Japan, 2000-2015
Japan’s Revenue from Animation Videogram, 2000-2015
Japan’s Revenue from Animation Distribution via the Internet, 2002-2015
Distribution of Japanese Animation Studios
Development History of Japanese Animation Industry
Japanese Animation Industry Chain
Japanese Animation Industry Investment Chain
Mid-term Production Price of Japanese Animation Companies (by Process), 2017
Scale of South Korea’s Main Animation and Derivatives Exports, 2010-2015
Policies Supporting China’s Animation Industry
Structure of Household Consumption Expenditure in China, 2016
Scale of Investment in China’s Culture and Entertainment Industry, 2013-2016
Total Value of Animation Industry and Growth Rate in China, 2009-20201E
ACG User Scale in China, 2013-2017
Distribution of Chinese Animation Enterprises, 2016
Participants in Animation Industry
Major Representative Companies in China’s Animation Industry Chain
Major Animation Images and Production Companies in China, 2007-2016
Chinese Government Subsidies for Animation Industry
China’s Animation Production Costs, 2015/2017
Comparison of Six Animation Satellite TV Channels in China
Introduction to Major Chinese Listed Animation Derivatives Companies
Revenue and Net Income of Major Chinese Animation Derivatives Enterprises, 2014-2016
Growth in Revenue and Net Income of Major Chinese Animation Derivatives Enterprises, 2014-2016
Layout of Overseas Animation Enterprises in China
Structure of Animation Content Consumption Market in China, 2016
Number of Chinese Animation Companies Securing Financing, 2008-2016
Financing of China Animation Industry, 2016
Three Types of Animation Industry Bases in China
List of Animation Industry Bases in China
Operation Mode of Animation Industry Bases in China
Number of China-made Cartoons, 2010-2017
Duration of China-made Cartoons, 2007-2021E
Quantity Structure of Chinese TV Animation (by Theme), 2016
Duration Structure of Chinese TV Animation (by Theme), 2016
Broadcast Time of TV Animation in China, 2011-2016
China’s TV Animation Imports and Exports, 2015
Animated Film Production in China, 2008-2021E
Animated Film Screenings in China, 2012-2017
Animated Film Viewers in China, 2012-2017
Animated Film Releases in China, 2008-2017
Box Office Earnings of China Animated Film Market, 2008-2017
Box Office Earnings from China-made Animated Films as a Percentage of Total from Animated Films, 2008-2021E
Number of China-made Animated Films with Over RMB50 million at the Box Office, 2010-2017
Regional Structure of Animated Films in China, 2016
Online Game Market Size in China, 2011-2021E
Structure of Online Game Market Size in China, 2011-2017
Number of Comic Readers in China, 2015-2021E
TOP 10 Chinese Comic Works on ac.qq.com
Payment Model of Comic Content in China
New Media Distribution Channels of Animation
Introduction to Mainstream Independent Animation Websites in China
China’s Smartphone Ownership by Age
Network Animation Coverage (by Age), 2016
China’s Internet Comics User Scale, 2013-2021E
China’s Animation Derivatives Market Size, 2009-2021E
China’s Animation Derivatives Market Share by Segment, 2016/2021E
China’s Animation Toy Market Size and YoY, 2009-2021E
Competition Pattern of China’s Animation Toy Market, 2016
China’s Animation Apparel Market Size, 2009-2021E
Supply Structure of Animation Apparel in China, 2016
China’s Exported Animation Apparel as a Percentage of Export Destination Consumption Amount, 2016
Major Chinese Animation Apparel Enterprises
Distribution of Disneyland in the World
Passenger Flow Volume of Shanghai Disney Resort
Theme Park Series of Shenzhen Huaqiang Holding Limited
China’s Animation Brand Licensing Market Size, 2014-2021E
China’s Brand Licensing Market Structure, 2015
Profile of Disney
Main Businesses of Disney
Global Business Distribution of Disney
Development History of Disney
Major Financial Indicators of Disney, FY2012-FY2016
Revenue and Operating Income of Disney by Segment, FY2014-FY2016
Revenue Structure of Disney by Geographic Region, FY2014-FY2016
Animation Business Architecture of Disney
Value Chain of Disney Brand
Industry Structure of Disney Brand
Business Model of Disney
Business Units of Bandai Namco Group
Business Model of Bandai Namco Group
Development History of Bandai Namco Group
Major Events of Bandai Namco Group
Major Financial Indicators of Bandai Namco Group, FY2011-FY2016
Net Sales and Segment Income of Bandai Namco Group, FY2015-FY2016
Development Plan of Bandai Namco Group, FY2017
Net Sales Structure of Bandai Namco Group by Geographic Region, FY2016
Medium Term Development Planning of Bandai Namco Group
Development Goals of Bandai Namco Group
Introduction of Hasbro
Business Industrial Chain of Hasbro
Development History of Hasbro
Development Phases of Hasbro Brands
Brands of Hasbro
Major Financial Indicators of Hasbro, 2012-2016
Revenue Breakdown of Hasbro by Product, 2014-2016
Revenue Breakdown of Hasbro by Business, 2014-2016
Branding Plan of Hasbro
Key Promotion Brands of Hasbro, 2015
Business of Toei Animation
Global Presence of Toei Animation
Development History of Toei Animation
Production Process of Cartoon Images of Toei Animation
Net Sales of Toei Animation by Business, FY2011-FY2015
Net Sales of Toei Animation by Market Segment, FY2011-FY2015
Net Sales of Toei Animation (by Geographic Region), FY2011-FY2015
Box Office Results of Dreamworks Movies, 1998-2016
Development History of Pixar Animation Studios
Box Office of Animated Films of Pixar Animation
Pixar Movies to be released, 2017-2019
Basic Information of Sotsu
Business Introduction of Sotsu
Development History of Sotsu
Sales and Net Income of Sotsu, FY2012-FY2017
Box Office of Animated Films of Studio Ghibli
Development History of Guangdong Alpha Animation And Culture, 2011-2017
Revenue and Net Income of Guangdong Alpha Animation And Culture
Revenue Structure of Guangdong Alpha Animation And Culture (by Business), 2010-2016
Animation Toy Output and Sales Volume of Guangdong Alpha Animation And Culture, 2014-2015
Revenue Structure of Guangdong Alpha Animation And Culture (by Region), 2006-2016
Gross Margin of Guangdong Alpha Animation And Culture (by Business), 2010-2016
R&D Costs and % of Total Revenue of Guangdong Alpha Animation And Culture, 2011-2016
Development History of Service Industrial Chain of Guangdong Alpha Animation And Culture
Capital Distribution of Guangdong Alpha Animation And Culture, 2010-2017
Revenue and Net Income of Guangdong Alpha Animation And Culture, 2016-2018E
Development History of Meisheng Cultural & Creative
Apparel Products of Meisheng Cultural & Creative
Revenue and Net Income of Meisheng Cultural & Creative, 2010-2016
Revenue Structure of Meisheng Cultural & Creative (by Business), 2015-2016
Revenue Structure of Meisheng Cultural & Creative (by Region), 2009-2016
Operational Data of Major Subsidiaries of Meisheng Cultural & Creative, 2016
Revenue and Net Income of Meisheng Cultural & Creative, 2016-2018E
Development History of Huawei Culture
Revenue and Net Income of Huawei Culture, 2009-2016
Revenue Structure of Huawei Culture (by Business), 2014-2016
Revenue Structure of Huawei Culture (by Region), 2010-2016
Operational Data of Major Subsidiaries of Huawei Culture, 2016H1
R&D Costs and % of Total Revenue of Huawei Culture, 2009-2016
Revenue and Net Income of Huawei Culture, 2016-2018E
Industrial Bases of Fantawild
Revenue and Net Income of Fantawild, 2014-2016
Revenue Structure of Fantawild (by Business), 2014-2016
Top 6 Clients of Fantawild, 2015
Top 5 Suppliers of Fantawild, 2015
Distribution of Fantawild Theme Parks in China
Culture Content Products and Services of Fantawild
Development Plan of Fantawild
Development History of Taomee
Main Businesses of Taomee
Major Partners of Zhejiang Zoland Animation
Revenue and Net Income of Zhejiang Zoland Animation, 2013-2016
Revenue and Gross Margin of Zhejiang Zoland Animation (by Business), 2013-2014
Zhejiang Zoland Animation’s Revenue from Top 5 Customers and % of Total Revenue, 2015
Top 5 Suppliers of Zhejiang Zoland Animation, 2015
R&D Costs and % of Total Revenue of Zhejiang Zoland Animation, 2013-2016
Business Architecture of Toonmax Media
Partners of Toonmax Media
Development Overview of CCTV Animation
Development History of Uyoung Media
Main Businesses of Uyoung Media
Major IP Works of Uyoung Media
A Comparison on Communication Channels of Animation Products
China’s Urbanization Rate, 1949-2016
China’s Birth Rate, 1949-2016
Output Value of China’s Animation Industry, 2017-2021E
如果这份报告不能满足您的要求,我们还可以为您定制报告,请 留言说明您的详细需求。
|