|
|
|
报告导航:研究报告—
制造业—汽车
|
|
2017-2021年中国客车行业研究报告 |
 |
字数:4.7万 |
页数:119 |
图表数:271 |
|
中文电子版:9000元 |
中文纸版:4500元 |
中文(电子+纸)版:9500元 |
|
英文电子版:2500美元 |
英文纸版:2700美元 |
英文(电子+纸)版:2800美元 |
|
编号:ZJF107
|
发布日期:2017-08 |
附件:下载 |
 |
|
|
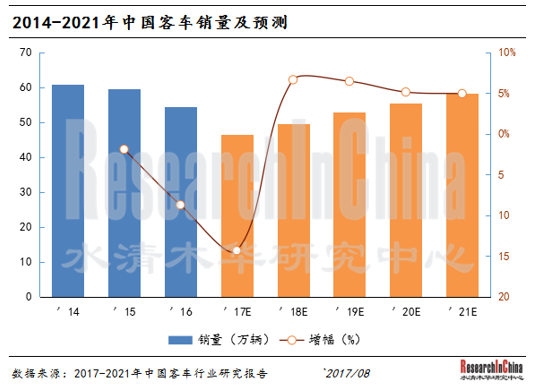
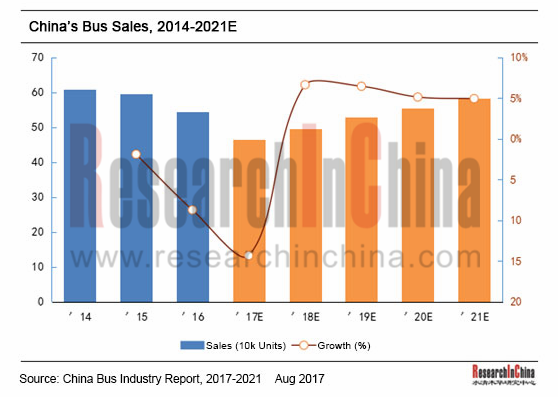
中国客车行业经过一轮快速增长之后,最近几年进入调整期,2016-2017年客车产销均呈下降趋势,其中2016年产销分别下降7.4%和8.7%,2017年上半年产销分别下降15.3%和14.0%。未来几年,受新能源汽车补贴退坡、技术门槛提高以及高铁竞争等因素影响,客车市场仍有较大的下滑空间,另一方面,城市公交网络化及新能源汽车的替代需求尚能为客车产业提供一些动力。因此,预计到2021年中国客车产销量分别达到57.24万辆以及58.27万辆,较2016年年均复合增长约0.9%及1.4%。
从市场结构来看,2016年中国大中型客车稳步增长,而轻型客车则下滑较快,该年大型客车产销9.02万辆和9.04万辆,同比增长5.23%和6.91%;中型客车产销9.90万辆和9.94万辆,同比增长26.60%和26.07%;轻型客车产销35.77万辆和35.36万辆,同比下降16.22%和18.14%。2017年上半年,整个客车市场全线下滑,大型客车产销2.85万辆和2.79万辆,同比下降18.26%和17.38%;中型客车产销均为2.60万辆,同比下降37.54%和36.36%;轻型客车产销16.42万辆和16.65万辆,同比下降9.71%和8.32%。
中国客车行业竞争格局相对较为稳定,市场集中度也较高,2016年,客车前十大厂商占据71.47%的市场份额,前五大厂商占据49.58%的市场份额。宇通客车和金龙汽车在大中轻等各产品线全面发展,稳居行业前列,包括江铃、金杯、福田等公司凭借轻型车的数量优势占据市场前五。
水清木华研究中心《2017-2021年中国客车行业研究报告》报告主要包括以下内容:
 客车行业概况(包括定义及分类,发展趋势,行业政策等); 客车行业概况(包括定义及分类,发展趋势,行业政策等);
中国客车行业发展总体概况(汽车产销量、保有量等)
中国客车细分市场概况,包括大型客车、中型客车及轻型客车的产销量、竞争格局等;
中国客车新能源客车市场分析,包括产销量、竞争格局以及产业政策等;
中国客车产业链情况,包括原材料市场、下游应用市场分析等;
宇通客车、中通客车、金龙汽车、东风汽车、福田汽车、江铃集团、江淮汽车等在内的16家厂商分析,包括公司简介、财务状况、产销量、主打产品、生产基地分布以及最新发展动态等。
China bus industry has entered a period of adjustment in recent years following a phase of rapid growth with bus output and sales presenting downward trends (a year-on-year fall of 7.4% and 8.7% in 2016 and 15.3% and 14.0% in the first half of 2017, respectively). Over the next couple of years, the bus market may well decline due to smaller new energy vehicle subsidies, higher technical barriers and competition from high-speed rail; however, urban bus network and alternative demand from new energy vehicles can still provide some impetus to the bus industry. Hence, the country’s output and sales of bus are expected to reach 572,400 units and 582,700 units in 2021, representing a CAGR of 0.9% and 1.4% over 2016, respectively.
Market structure: Large and medium-sized buses grew rapidly while light bus fell at a faster rate in 2016. The output and sales of large bus were 90,200 units and 90,400 units, up 5.23% and 6.91% year on year, respectively; for medium-sized bus, 99,000 units were produced and 99,400 units sold, a 26.60% and 26.07% rise over the previous year separately; regarding light bus, 357,700 units were produced and 353,600 units sold, down 16.22% and 18.14% from a year ago individually. The bus market slid across the board in the first half of 2017 with the output and sales of large bus going down 18.26% and 17.38% to 28,500 units and 27,900 units respectively, of medium-sized bus down 37.54% and 36.36% to both 26,000 units, and of light bus down 9.71% and 8.32% to 164,200 units and 166,500 units separately, all on year-on-year basis.
Competitive landscape: relatively stable but highly concentrated. In 2016, top10 bus makers seized a combined market share of 71.47% and top5 ones 49.58%. With complete product lines (large, medium-sized and light buses), Yutong Bus and Xiamen King Long Motor Group retained the top spots, while JMC, Shenyang Jinbei Automotive and Beiqi Foton Motor, by virtue of their numerical advantage of light bus, joined the top5 positions.
China Bus Industry Report, 2017-2021 highlights the following:
 Overview of the bus industry (definition & classification, development trends, industry policies, etc.); Overview of the bus industry (definition & classification, development trends, industry policies, etc.);
Overview of the bus industry in China (output & sales, ownership, etc.);
Bus market segments (large, medium-sized and light buses) (output & sales, competitive landscape, etc.);
Chinese new energy bus market (output & sales, competitive landscape, industry policies, etc.);
Bus industry chain in China (raw material markets, application markets, etc.);
16 makers including Yutong Bus, Zhongtong Bus, Xiamen King Long Motor Group, Dongfeng Automobile, Beiqi Foton Motor, JMCG and JAC (profile, financial position, output & sales, hit products, production bases, latest developments, etc.).
第一章 行业概述
1.1 产品简介
1.2 产品分类
1.3 相关政策
1.4 客车主动安全与车联网
1.4.1 政策及规划
1.4.2 技术标准
1.4.3 企业布局
第二章 中国客车整体市场
2.1 市场规模
2.2 市场结构
2.3 竞争格局
2.3.1 市场份额
2.3.2 业绩对比
2.4 细分市场
2.4.1 座位客车市场
2.4.2 公交车市场
2.4.3 校车市场
2.5 天然气客车
第三章 中国客车细分市场
3.1大型客车市场
3.1.1 市场规模
3.1.2 竞争格局
3.2中型客车市场
3.2.1 市场规模
3.2.2 竞争格局
3.3 轻型客车市场
3.3.1 市场规模
3.3.2 竞争格局
第四章 新能源客车市场
4.1 市场规模
4.2 竞争格局
4.3 产业政策
4.3.1财政补贴政策
4.3.2“削油补电”政策
4.3.3 推广考核办法
4.4 技术路线
4.5 燃料电池客车
第五章 客车产业链
5.1 上游原材料市场
5.2 关键零部件
5.2.1 变速器
5.2.2 轮毂
5.2.3 新能源电池
5.3 下游需求市场
5.3.1 客运
5.3.2 高铁
5.3.3 旅游
第六章 主要企业
6.1 宇通客车
6.1.1 企业简介
6.1.2 财务概况
6.1.3 主营构成
6.1.4 产销量
6.1.5 新能源客车
6.1.6 生产能力
6.1.7 研发费用
6.1.8 成本构成
6.1.9 零部件配套
6.1.10 发展动态
6.1.11 经营前景
6.2 金龙汽车
6.2.1 企业简介
6.2.2 财务概况
6.2.3 主营构成
6.2.4 主要子公司经营情况
6.2.5 产销量
6.2.6 新能源客车
6.2.7 生产能力
6.2.8 研发费用
6.2.9 成本构成
6.2.10 发展动态
6.2.11 经营前景
6.3 中通客车
6.3.1 企业简介
6.3.2 财务概况
6.3.3 主营构成
6.3.4 产销量
6.3.5 新能源客车
6.3.6 研发费用
6.3.7 成本构成
6.3.8 发展动态
6.3.9 经营前景
6.4 福田汽车股份有限公司
6.4.1 企业简介
6.4.2 财务概况
6.4.3 主营构成
6.4.4 产销量
6.4.5 新能源客车
6.4.6 生产能力
6.4.7 研发费用
6.4.8 经营前景
6.5 安凯客车
6.5.1 企业简介
6.5.2 财务概况
6.5.3 主营构成
6.5.4 产销量
6.5.5 新能源客车
6.5.6 生产能力
6.5.7 研发费用
6.5.8 成本构成
6.6 辽宁曙光汽车集团股份有限公司
6.6.1 企业简介
6.6.2 财务概况
6.6.3 主营构成
6.6.4 产销量
6.6.5 新能源业务
6.6.6 成本构成
6.7 扬州亚星客车股份有限公司
6.7.1 企业简介
6.7.2 财务概况
6.7.3 主营构成
6.7.4 产销量
6.7.5 新能源客车
6.7.6 研发费用
6.7.7 成本构成
6.8 比亚迪
6.8.1 企业简介
6.8.2 财务概况
6.8.3 主营构成
6.8.4 产销量
6.8.5 新能源客车
6.8.6 发展动态
6.9 江淮汽车
6.9.1 企业简介
6.9.2 财务概况
6.9.3 主营构成
6.9.4 产销量
6.9.5 研发费用
6.9.6 成本构成
6.9.7 经营前景
6.10 金杯汽车
6.10.1 企业简介
6.10.2 财务概况
6.10.3 主营构成
6.10.4 产销量
6.10.5 研发费用
6.10.6 成本构成
6.10.7 经营前景
6.11 江铃汽车
6.11.1 企业简介
6.11.2 财务概况
6.11.3 主营构成
6.11.4 产销量
6.11.5 研发费用
6.11.6 经营前景
6.12 东风汽车
6.12.1 企业简介
6.12.2 财务概况
6.12.3 主营构成
6.12.4 产销量
6.12.5 研发费用
6.12.6 成本构成
6.12.7 经营前景
1 Industry Overview
1.1 Introduction to Product
1.2 Product Classification
1.3 Policies
1.4 Active Safety and Connected Car
1.4.1 Policy and Planning
1.4.2 Technical Standards
1.4.3 Enterprises’ Layout
2 Chinese Bus Market
2.1 Market Size
2.2 Market Structure
2.3 Competitive Landscape
2.3.1 Market Share
2.3.2 Performance Comparison
2.4 Market Segments
2.4.1 Coach
2.4.2 Public Bus
2.4.3 School Bus
2.5 Natural-gas Bus
3 Chinese Bus Market Segments
3.1 Large Bus
3.1.1 Market Size
3.1.2 Competitive Landscape
3.2 Medium-sized Bus
3.2.1 Market Size
3.2.2 Competitive Landscape
3.3 Light Bus
3.3.1 Market Size
3.3.2 Competitive Landscape
4 New Energy Bus Market
4.1 Market Size
4.2 Competitive Landscape
4.3 Industry Policies
4.3.1 Policies on Fiscal Subsidies
4.3.2 Policy of Cutting Subsidies for Diesel Oil and Increasing Subsidies for Electric Bus
4.3.3 Promotion and Assessment Methods
4.4 Technical Routes
4.5 Fuel-cell Bus
5 Bus Market Industry Chain
5.1 Upstream Raw Material Market
5.2 Key Components
5.2.1 Transmission
5.2.2 Wheel
5.2.3 New Energy Battery
5.3 Downstream Demand Market
5.3.1 Passenger Transport
5.3.2 High-speed Rail
5.3.3 Tourism
6 Major Enterprises
6.1 Zhengzhou Yutong Bus Co., Ltd.
6.1.1 Profile
6.1.2 Financial Position
6.1.3 Operating Revenue Structure
6.1.4 Output and Sales
6.1.5 New Energy Bus
6.1.6 Production Capacity
6.1.7 R&D Costs
6.1.8 Cost Structure
6.1.9 Components & Parts
6.1.10 Developments
6.1.11 Operational Prospects
6.2 Xiamen King Long Motor Group
6.2.1 Profile
6.2.2 Financial Position
6.2.3 Operating Revenue Structure
6.2.4 Operation of Major Subsidiaries
6.2.5 Output and Sales
6.2.6 New Energy Bus
6.2.7 Production Capacity
6.2.8 R&D Costs
6.2.9 Cost Structure
6.2.10 Developments
6.2.11 Operational Prospects
6.3 Zhongtong Bus and Holding Co., Ltd.
6.3.1 Profile
6.3.2 Financial Position
6.3.3 Operating Revenue Structure
6.3.4 Output and Sales
6.3.5 New Energy Bus
6.3.6 R&D Costs
6.3.7 Cost Structure
6.3.8 Developments
6.3.9 Operational Prospects
6.4 Beiqi Foton Motor Co., Ltd.
6.4.1 Profile
6.4.2 Financial Position
6.4.3 Operating Revenue Structure
6.4.4 Output and Sales
6.4.5 New Energy Bus
6.4.6 Production Capacity
6.4.7 R&D Costs
6.4.8 Operational Prospects
6.5 Anhui Ankai Automobile Co., Ltd.
6.5.1 Profile
6.5.2 Financial Position
6.5.3 Operating Revenue Structure
6.5.4 Output and Sales
6.5.5 New Energy Bus
6.5.6 Production Capacity
6.5.7 R&D Costs
6.5.8 Cost Structure
6.6 Liaoning SG Automotive Group Co., Ltd.
6.6.1 Profile
6.6.2 Financial Position
6.6.3 Operating Revenue Structure
6.6.4 Output and Sales
6.6.5 New Energy Business
6.6.6 Cost Structure
6.7 Yangzhou Asiastar Bus Co., Ltd.
6.7.1 Profile
6.7.2 Financial Position
6.7.3 Operating Revenue Structure
6.7.4 Output and Sales
6.7.5 New Energy Bus
6.7.6 R&D Costs
6.7.7 Cost Structure
6.8 BYD
6.8.1 Profile
6.8.2 Financial Position
6.8.3 Operating Revenue Structure
6.8.4 Output and Sales
6.8.5 New Energy Bus
6.8.6 Developments
6.9 Anhui Jianghuai Automobile Co., Ltd.
6.9.1 Profile
6.9.2 Financial Position
6.9.3 Operating Revenue Structure
6.9.4 Output and Sales
6.9.5 R&D Costs
6.9.6 Cost Structure
6.9.7 Operational Prospects
6.10 Shenyang Jinbei Automotive Co., Ltd.
6.10.1 Profile
6.10.2 Financial Position
6.10.3 Operating Revenue Structure
6.10.4 Output and Sales
6.10.5 R&D Costs
6.10.6 Cost Structure
6.10.7 Operational Prospects
6.11 Jiangling Motors Co., Ltd.
6.11.1 Profile
6.11.2 Financial Position
6.11.3 Operating Revenue Structure
6.11.4 Output and Sales
6.11.5 R&D Costs
6.11.6 Operational Prospects
6.12 Dongfeng Motor Corporation
6.12.1 Profile
6.12.2 Financial Position
6.12.3 Operating Revenue Structure
6.12.4 Output and Sales
6.12.5 R&D Costs
6.12.6 Cost Structure
6.12.7 Operational Prospects
中国主要客车企业智能运营系统
2005-2021年中国客车产销量
2005-2021年中国客车市场结构
2014年中国客车企业TOP10
2015年中国客车企业TOP10
2016年中国客车企业TOP10
2017年中国客车企业TOP10
2014-2017年中国主要客车企业营业收入
2014-2017年中国主要客车企业净利润
2014-2017年中国主要客车企业毛利率
2014-2016年中国各类客车销量(分用途)
2016年中国大中型座位客车市场结构(分用途)
2014-2016年中国各类公交车销量
2009-2016年中国校车销量
2014-2017年中国天然气客车产销量
2005-2021年中国大型客车及底盘产量
2005-2021年中国大型客车及底盘销量
2014年中国大型客车整车企业TOP10
2014年中国大型客车底盘企业市场份额
2015年中国大型客车整车企业TOP10
2015年中国大型客车底盘企业市场份额
2016年中国大型客车整车企业TOP10
2016年中国大型客车底盘企业市场份额
2017年中国大型客车整车企业TOP10
2017年中国大型客车底盘企业市场份额
2005-2021年中国中型客车及底盘产量
2005-2021年中国中型客车及底盘销量
2014年中国中型客车整车企业TOP10
2014年中国中型客车底盘企业市场份额
2015年中国中型客车整车企业TOP10
2015年中国中型客车底盘企业市场份额
2016年中国中型客车整车企业TOP10
2016年中国中型客车底盘企业市场份额
2017年中国中型客车整车企业TOP10
2017年中国中型客车底盘企业市场份额
2005-2021年中国轻型客车及底盘产量
2005-2021年中国轻型客车及底盘销量
2014年中国轻型客车整车企业TOP10
2014年中国轻型客车底盘企业市场份额
2015年中国轻型客车整车企业TOP10
2015年中国轻型客车底盘企业市场份额
2016年中国轻型客车整车企业TOP10
2016年中国轻型客车底盘企业市场份额
2017年中国轻型客车整车企业TOP10
2017年中国轻型客车底盘企业市场份额
2016-2017年中国新能源客车产量
2016-2017年中国新能源客车(分厂商)产量TOP20
2016-2017年中国纯电动客车(分厂商)产量TOP20
2016-2017年中国插电式混合动力客车(分厂商)产量TOP 20
2017年电动客车补贴标准
2014-2016年中国主要客车企业原材料成本对比
中国商用车变速器主要企业市场份额
中国主要商用车变速器配套企业
中国主要客车企业轮毂供应商
2004-2017年中国公路客运情况
2013-2016年中国高铁营业里程
2001-2016年中国旅游业总收入
2008-2017年中国黄金周游客数量
2012-2017年宇通客车主要财务指标
2013-2016年宇通客车主营收入构成(分业务)
2013-2016年宇通客车主营收入构成(分区域)
2012-2017年宇通客车各类产品产销量
2015-2016年宇通客车销售结构
2014-2017年宇通新能源客车产量
2012-2016年宇通新能源客车销量
2015-2016年宇通客车各类新能源客车销量
2009-2016年宇通客车研发费用
2014-2016年宇通客车产品成本构成
2015-2021年宇通客车营业收入、净利润及毛利率预测
2012-2017年金龙汽车主要财务指标
2015-2016年金龙汽车主要产品营业收入及毛利率
2013-2016年金龙汽车主营收入构成(分区域)
2014-2016年金龙汽车主要子公司营业收入及净利润
2012-2017年金龙汽车各子公司客车产量
2012-2017年金龙汽车各子公司客车销量
2012-2017年金龙汽车卡车产销量
2014-2017年金龙新能源客车产量
2015-2016年金龙各类新能源客车销量(分长度)
2015-2016年金龙各类新能源客车销量(分用途)
金龙新能源客车核心零部件外购比例
2010-2016年金龙汽车研发费用
2013-2016年金龙汽车成本构成
2015-2021年金龙汽车营业收入、净利润及毛利率
2012-2017年中通客车主要财务指标
2013-2016年中通客车主营收入构成(分业务)
2013-2016年中通客车主营收入构成(分区域)
2012-2017年中通客车产销量
2014-2017年中通新能源客车产量
2012-2016年中通客车研发费用
2013-2016年中通客车成本构成
2015-2021年中通客车营业收入、净利润及毛利率
2010-2017年福田汽车主要财务指标
2014-2016年福田汽车主营收入构成(分业务)
2013-2016年福田汽车主营收入构成(分区域)
2012-2017年福田汽车各类客车产销量
2014-2017年福田新能源客车产量
2013-2016年福田欧辉新能源客车销量
2010-2016年福田汽车研发费用
2015-2021年福田汽车营业收入、净利润及毛利率
2012-2017年安凯客车财务指标
2015-2016年安凯客车主营收入构成(分业务)
2013-2016年安凯客车主营收入构成(分区域)
2012-2017年安凯客车产销量
2014-2017年安凯新能源客车产量
2010-2016年安凯客车研发费用
2015-2016年安凯客车成本构成
2012-2017年曙光股份财务指标
2013-2016年曙光股份主营收入构成(分业务)
2013-2016年曙光股份主营收入构成(分区域)
2012-2017年曙光股份(丹东黄海)客车产销量
2014-2017年曙光股份黄海新能源客车产量
2014-2016年曙光股份成本构成
2012-2017年亚星客车财务指标
2013-2016年亚星客车主营收入构成(分业务)
2013-2016年亚星客车主营收入构成(分区域)
2012-2017年亚星客车产销量
2014-2016年亚星新能源客车产销量
2015-2016年亚星新能源客车补贴收入
2010-2016年亚星客车研发费用
2014-2016年亚星客车成本构成
2012-2017年比亚迪财务指标
2013-2016年比亚迪主营收入构成(分业务)
2015-2016年比亚迪主营收入构成(分区域)
2012-2017年比亚迪客车产销量
比亚迪新能源客车主要产品
2016年比亚迪新能源主要整车生产基地产能及产量
2016年比亚迪重点订单情况
2012-2017年江淮汽车财务指标
2015-2016年江淮汽车主营收入构成(分业务)
2013-2016年江淮汽车主营收入构成(分区域)
2012-2017年江淮汽车客车产销量
2010-2016年江淮汽车研发费用
2016年江淮汽车成本构成
2014-2021年江淮汽车营业收入、净利润及毛利率
2012-2017年金杯汽车财务指标
2013-2016年金杯汽车主营收入构成(分业务)
2013-2016年金杯汽车主营收入构成(分区域)
2012-2017年金杯汽车商用车产销量
2012-2016年金杯汽车研发费用
2014-2016年金杯汽车成本构成
2015-2021年金杯汽车营业收入、净利润及毛利率
2012-2017年江铃汽车财务指标
2013-2016年江铃汽车主营收入构成(分业务)
2012-2017年江铃汽车客车产销量
2010-2016年江铃汽车研发费用
2015-2021年江铃汽车营业收入、净利润及毛利率
2012-2017年东风汽车财务指标
2013-2016年东风汽车主营收入构成(分业务)
2013-2016年东风汽车主营收入构成(分区域)
2012-2017年东风汽车客车产销量
2010-2016年东风汽车研发费用
2014-2016年东风汽车成本构成
2015-2021年东风汽车营业收入、净利润及毛利率
2012-2017年上汽大通客车产销量
2016年上汽大通产能(包括新能源)
2016年上汽大通在建工程
2015-2016年上汽大通新能源汽车产销量及销售收入
Intelligent Operational Systems of Major Bus Enterprises in China
China’s Bus Output and Sales, 2005-2021E
Chinese Bus Market Structure, 2005-2021E
Top10 Bus Enterprises in China, 2014
Top10 Bus Enterprises in China, 2015
Top10 Bus Enterprises in China, 2016
Top10 Bus Enterprises in China, 2017
Revenue of Major Bus Enterprises in China, 2014-2017
Net Income of Major Bus Enterprises in China, 2014-2017
Gross Margin of Major Bus Enterprises in China, 2014-2017
Bus Sales in China by Application, 2014-2016
Chinese Large and Medium-sized Coach Market Structure by Application, 2016
Public Bus Sales in China, 2014-2016
School Bus Sales in China, 2009-2016
Natural-gas Bus Sales in China, 2014-2017
Large Bus and Chassis Output in China, 2005-2021E
Large Bus and Chassis Sales in China, 2005-2021E
Top10 Large Bus Makers in China, 2014
Market Share of Large Bus Chassis Enterprises in China, 2014
Top10 Large Bus Makers in China, 2015
Market Share of Large Bus Chassis Enterprises in China, 2015
Top10 Large Bus Makers in China, 2016
Market Share of Large Bus Chassis Enterprises in China, 2016
Top10 Large Bus Makers in China, 2017
Market Share of Large Bus Chassis Enterprises in China, 2017
Medium-sized Bus and Chassis Output in China, 2005-2021E
Medium-sized Bus and Chassis Sales in China, 2005-2021E
Top10 Medium-sized Bus Makers in China, 2014
Market Share of Medium-sized Bus Chassis Enterprises in China, 2014
Top10 Medium-sized Bus Makers in China, 2015
Market Share of Medium-sized Bus Chassis Enterprises in China, 2015
Top10 Medium-sized Bus Makers in China, 2016
Market Share of Medium-sized Bus Chassis Enterprises in China, 2016
Top10 Medium-sized Bus Makers in China, 2017
Market Share of Medium-sized Bus Chassis Enterprises in China, 2017
Light Bus and Chassis Output in China, 2005-2021E
Light Bus and Chassis Sales in China, 2005-2021E
Top10 Light Bus Makers in China, 2014
Market Share of Light Bus Chassis Enterprises in China, 2014
Top10 Light Bus Makers in China, 2015
Market Share of Light Bus Chassis Enterprises in China, 2015
Top10 Light Bus Makers in China, 2016
Market Share of Light Bus Chassis Enterprises in China, 2016
Top10 Light Bus Makers in China, 2017
Market Share of Light Bus Chassis Enterprises in China, 2017
New Energy Bus Output in China, 2016-2017
Top20 New Energy Bus Makers in China by Output, 2016-2017
Top20 Battery Electric Bus Makers in China by Output, 2016-2017
Top20 Plug-in Hybrid Bus Makers in China by Output, 2016-2017
Subsidy Standards for Electric Bus, 2017
Raw Material Costs of Major Bus Makers in China, 2014-2016
Market Share of Major Commercial Vehicle Transmission Producers in China
Major Suppliers of Commercial Vehicle Transmission in China
Wheel Hub Suppliers of Major Bus Makers in China
Highway Passenger Transportation in China, 2004-2017
High-speed Rail Mileage in China, 2013-2016
Total Tourism Revenue in China, 2001-2016
Number of Tourists during the Chinese Golden Week Holiday, 2008-2017
Main Financial Indicators of Yutong Bus, 2012-2017
Operating Revenue Structure of Yutong Bus by Business, 2013-2016
Operating Revenue Structure of Yutong Bus by Region, 2013-2016
Output and Sales of Yutong Bus by Product, 2012-2017
Sales Structure of Yutong Bus, 2015-2016
New Energy Bus Output of Yutong Bus, 2014-2017
New Energy Bus Sales of Yutong Bus, 2012-2016
New Energy Bus Sales of Yutong Bus by Type, 2015-2016
R&D Costs of Yutong Bus, 2009-2016
Product Cost Structure of Yutong Bus, 2014-2016
Revenue, Net Income, and Gross Margin of Yutong Bus, 2015-2021E
Main Financial Indicators of Xiamen King Long Motor Group, 2012-2017
Operating Revenue and Gross Margin of Xiamen King Long Motor Group's Major Products, 2015-2016
Operating Revenue Structure of Xiamen King Long Motor Group by Region, 2013-2016
Revenue and Net Income of Major Subsidiaries of Xiamen King Long Motor Group, 2014-2016
Bus Output of Subsidiaries of Xiamen King Long Motor Group, 2012-2017
Bus Sales of Subsidiaries of Xiamen King Long Motor Group, 2012-2017
Truck Output and Sales of Xiamen King Long Motor Group, 2012-2017
New Energy Bus Output of Xiamen King Long Motor Group, 2014-2017
New Energy Bus Sales of Xiamen King Long Motor Group by Length, 2015-2016
New Energy Bus Sales of Xiamen King Long Motor Group by Application, 2015-2016
Percentage of Key Parts Purchased by Xiamen King Long Motor Group for New Energy Bus
R&D Costs of Xiamen King Long Motor Group, 2010-2016
Cost Structure of Xiamen King Long Motor Group, 2013-2016
Revenue, Net Income, and Gross Margin of Xiamen King Long Motor Group, 2015-2021E
Main Financial Indicators of Zhongtong Bus, 2012-2017
Operating Revenue Structure of Zhongtong Bus by Business, 2013-2016
Operating Revenue Structure of Zhongtong Bus by Region, 2013-2016
Output and Sales of Zhongtong Bus, 2012-2017
New Energy Bus Output of Zhongtong Bus, 2014-2017
R&D Costs of Zhongtong Bus, 2012-2016
Cost Structure of Zhongtong Bus, 2013-2016
Revenue, Net Income, and Gross Margin of Zhongtong Bus, 2015-2021E
Main Financial Indicators of Beiqi Foton Motor, 2010-2017
Operating Revenue Structure of Beiqi Foton Motor by Business, 2014-2016
Operating Revenue Structure of Beiqi Foton Motor by Region, 2013-2016
Bus Output and Sales of Beiqi Foton Motor by Type, 2012-2017
New Energy Bus Output of Beiqi Foton Motor, 2014-2017
New Energy Bus Sales of FOTON AUV, 2013-2016
R&D Costs of Beiqi Foton Motor, 2010-2016
Revenue, Net Income, and Gross Margin of Beiqi Foton Motor, 2015-2021E
Financial Indicators of Anhui Ankai Automobile, 2012-2017
Operating Revenue Structure of Anhui Ankai Automobile by Business, 2015-2016
Operating Revenue Structure of Anhui Ankai Automobile by Region, 2013-2016
Output and Sales of Anhui Ankai Automobile, 2012-2017
New Energy Bus Output of Anhui Ankai Automobile, 2014-2017
R&D Costs of Anhui Ankai Automobile, 2010-2016
Cost Structure of Anhui Ankai Automobile, 2015-2016
Financial Indicators of SG Automotive Group, 2012-2017
Operating Revenue Structure of SG Automotive Group by Business, 2013-2016
Operating Revenue Structure of SG Automotive Group by Region, 2013-2016
Huanghai Bus Output and Sales Volume of SG Automotive Group, 2012-2017
Huanghai New Energy Bus Output of SG Automotive Group, 2014-2017
Cost Structure of SG Automotive Group, 2014-2016
Financial Indicators of Asiastar Bus, 2012-2017
Operating Revenue Structure of Asiastar Bus by Business, 2013-2016
Operating Revenue Structure of Asiastar Bus by Region, 2013-2015
Output and Sales of Asiastar, 2012-2017
New Energy Bus Sales Volume of Asiastar, 2014-2016
Asiastar’s Income from New Energy Bus Subsidies, 2015-2016
R&D Costs of Asiastar, 2010-2016
Cost Structure of Asiastar, 2014-2016
Financial Indicators of BYD, 2012-2017
Operating Revenue Structure of BYD by Business, 2013-2016
Operating Revenue Structure of BYD by Region, 2015-2016
Bus Output and Sales Volume of BYD, 2012-2017
Main New Energy Buses of BYD
Capacity and Output of BYD’s Major New Energy Bus Bases, 2016
Key Orders of BYD, 2016
Financial Indicators of JAC, 2012-2017
Operating Revenue Structure of JAC by Business, 2015-2016
Operating Revenue Structure of JAC by Region, 2013-2016
Bus Output and Sales of JAC, 2012-2017
R&D Costs of JAC, 2010-2016
Cost Structure of JAC, 2016
Revenue, Net Income, and Gross Margin of JAC, 2014-2021E
Financial Indicators of Jinbei Auto, 2012-2017
Operating Revenue Structure of Jinbei Auto by Business, 2013-2016
Operating Revenue Structure of Jinbei Auto by Region, 2013-2016
Commercial Vehicle Output and Sales of Jinbei Auto, 2012-2017
R&D Costs of Jinbei Auto, 2012-2016
Cost Structure of Jinbei Auto, 2014-2016
Revenue, Net Income, and Gross Margin of Jinbei Auto, 2015-2021E
Financial Indicators of JMC, 2012-2017
Operating Revenue Structure of JMC by Business, 2013-2016
Bus Output and Sales of JMC, 2012-2017
R&D Costs of JMC, 2010-2016
Revenue, Net Income, and Gross Margin of JMC, 2015-2021E
Financial Indicators of Dongfeng Motor, 2012-2017
Operating Revenue Structure of Dongfeng Motor by Business, 2013-2016
Operating Revenue Structure of Dongfeng Motor by Region, 2013-2016
Bus Output and Sales of Dongfeng Motor, 2012-2017
R&D Costs of Dongfeng Motor, 2010-2016
Cost Structure of Dongfeng Motor, 2014-2016
Revenue, Net Income, and Gross Margin of Dongfeng Motor, 2015-2021E
Bus Output and Sales of SAIC MAXUS, 2012-2017
Capacity of SAIC MAXUS (including New Energy), 2016
Ongoing Projects of SAIC MAXUS, 2016
New Energy Vehicle Output, Sales Volume, and Revenue of SAIC MAXUS, 2015-2016
如果这份报告不能满足您的要求,我们还可以为您定制报告,请 留言说明您的详细需求。
|