|
|
|
报告导航:研究报告—
制造业—工业机械
|
|
2018-2022年全球及中国电梯行业研究报告 |
 |
字数:5.3万 |
页数:198 |
图表数:200 |
|
中文电子版:8000元 |
中文纸版:6400元 |
中文(电子+纸)版:8500元 |
|
英文电子版:2800美元 |
英文纸版:3000美元 |
英文(电子+纸)版:3100美元 |
|
编号:ZLC-069
|
发布日期:2018-11 |
附件:下载 |
 |
|
|
2017年,全球新梯销量微量增长至79.3万台,同比增长3%,增长主要来自亚太和欧洲地区的需求增长;全球电梯保有量估计达1450万台。预计2018年,在全球经济保持稳定发展的前提下,全球新梯销量仍将保持增长态势,销量有望达81.3万台,同比增长2.5%。
亚太地区是全球电梯的主要生产及消费市场,而中国也已成为全球最大的电梯生产和消费市场,全球主要的电梯品牌均已在中国建立独资或合资企业,是电梯领域的世界工厂和制造中心。
新梯市场方面:
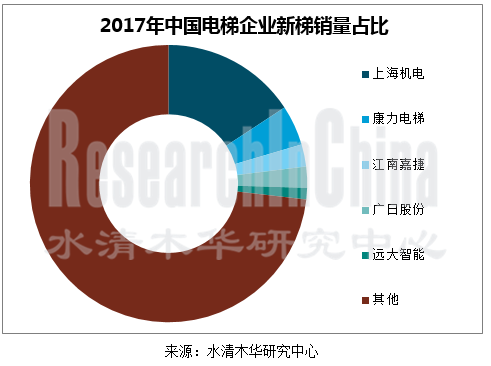
2017年,中国电梯销量约48万台,较上年增长2.1%,主要受房地产市场增长带动。从企业销量来看,除经营规模相对更小的江南嘉捷和远大智能外,上海机电、广日股份和康力电梯的新梯销量均有不同程度的上升。其中,上海机电销量相对最高,达75600台,同比增长达9.4%,占总销量的15.8%。
未来几年,在城镇化和老龄化的推动下,加之城市轨道交通进入快速发展期,旧梯安装电梯政策逐步实施,以及需更换的旧电梯数量增加,预计未来五年,中国电梯行业仍将保持稳步增长态势,预计到2022年,中国新梯销量有望达到56万台。
维保市场方面:
近几年,中国电梯保有量逐年增长,截至2017年底保有量估计达480万台。保有量的增长促进了电梯维保业务的增长,按8000元/台的电梯维保费计算,目前中国电梯维保市场规模达384亿元。预计到2022年,市场规模将达520亿元。
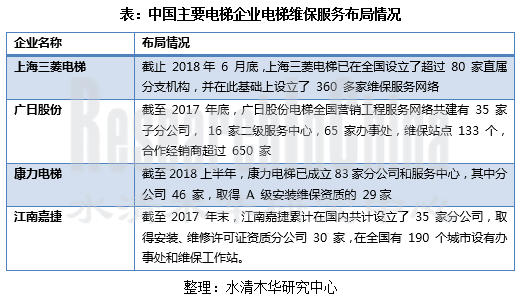
目前,中国电梯维保市场处于无序竞争状态。由于电梯维保市场具有毛利高,市场空间巨大的特点,内外资品牌都非常重视维保业务的发展,纷纷布局维保市场,未来中国电梯维保市场有望实现有序化发展。
《2018-2022年中国电梯行业研究报告》主要包括以下内容:
 全球电梯行业发展概况,包括新梯市场、维保市场和竞争格局分析; 全球电梯行业发展概况,包括新梯市场、维保市场和竞争格局分析;
中国电梯行业发展概况,包括新梯市场、维保市场、竞争格局及发展趋势分析;
中国电梯行业需求分析,包括下游需求、需求构成、需求影响因素分析等;
国内10家、国外7家企业分析,主要包括经营情况、电梯业务、研发投资、发展战略分析等。
In 2017, a total of 793,000 new elevators were sold globally, a slight rise of 3% from a year earlier, thanks to the increased demand from Asia-Pacific and Europe, bringing global elevator ownership to estimated 14.5 million units. It is predicted that in 2018 global new elevator sales will sustain growth in the context that global economy is on a steady rise, expectedly reaching 813,000 units with a year-on-year increase of 2.5%.
Globally, most elevators are produced and sold in Asia-Pacific region and China is the largest producer and consumer of elevators. World-renowned elevator brands have set up their either own companies or joint ventures in China, making the country a center of global elevator production.
New elevator market:
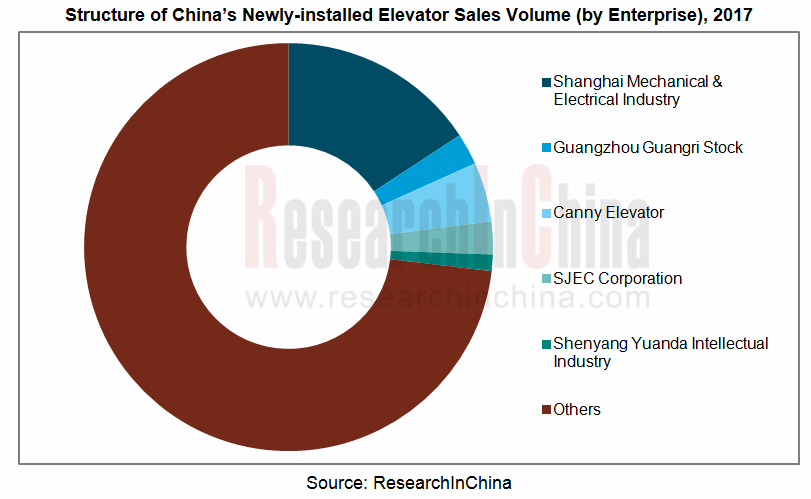
In 2017, around 480,000 elevators were sold in China, up 2.1% year on year driven by the property market growth. Shanghai Mechanical & Electrical Industry Co., Ltd., Guangzhou Guangri Stock Co., Ltd. and Canny Elevator (except for players with smaller business scale, like SJEC Corporation and Shenyang Yuanda Intellectual Industry Group) saw a varied increase in new elevator sales, of which Shanghai Mechanical & Electrical Industry Co., Ltd. reached the highest 75,600 units, a year-on-year increase of 9.4%, a 15.8% share of the total.
Under the impetus of urbanization, aging population, fast-growing urban rail transit, enforcement of the policy for elevator installation in old buildings as well as a growing number of old elevators to be replaced, Chinese elevator market will continue to grow steadily in the next five years, and till 2022 the sales of new elevators is anticipated to record 560,000 units.
Maintenance Market:
The ownership of elevators has been climbing in China year after year. By the end of 2017, there had been a total of 4.8 million elevators in China. Higher ownership has contributed to the robust elevator maintenance business. Assuming the maintenance cost of RMB8,000/year for each elevator, Chinese elevator maintenance market size now reaches RMB38.4 billion and will fetch RMB52 billion by 2022.
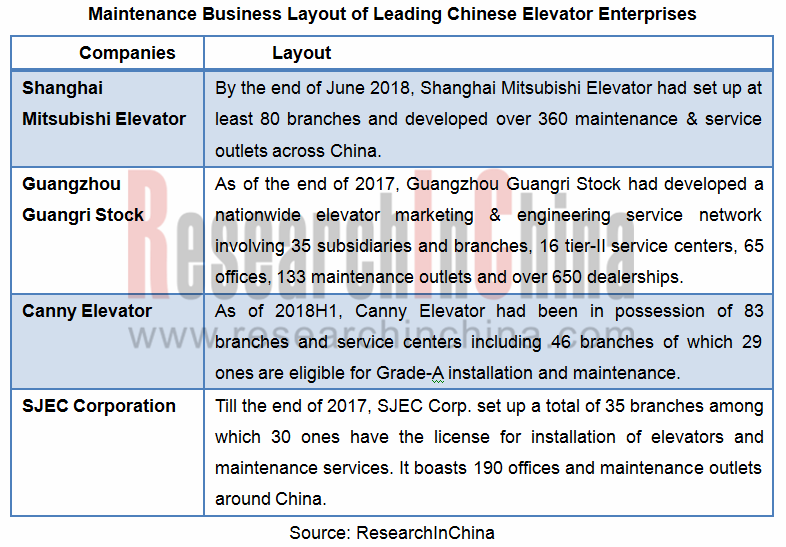
At present, Chinese elevator maintenance market is in a state of disorderly competition. As the elevator maintenance is featured with high gross margin and huge market space, Chinese and foreign brands attach great importance to the development of the maintenance business, and they have rushed into the maintenance market successively. In the future, Chinese elevator maintenance market will be developing in an orderly and sound way.
Global and China Elevator Industry Report, 2018-2022 highlights the following:
 Global elevator industry (new elevator market, maintenance market and competitive landscape); Global elevator industry (new elevator market, maintenance market and competitive landscape);
China elevator industry (new elevator market, maintenance market, competitive pattern and development tendency);
Elevator demand in China (demand from downstream sectors, demand structure, factors influencing demand);
7 foreign and 10 Chinese companies (operation, elevator business, R&D and investments, development strategies, etc.)
第一章 概述
1.1 定义及分类
1.2 政策环境
第二章 全球电梯行业发展概况
2.1 新梯市场
2.1.1 全球销量
2.1.2 各地区销量
2.2 维保市场
2.2.1 电梯保有量
2.2.2 维保市场成主要增长点
2.3 竞争格局
2.4 发展模式
2.4.1 两种模式
2.4.2 发展亚太地区业务
2.4.3 全球化扩张
第三章 中国电梯行业发展概况
3.1 产品结构
3.2 新梯市场
3.2.1 发展现状
3.2.2 电梯销量
3.2.3 主要电梯企业新梯销售情况
3.2.4 新梯市场规模
3.3 维保市场
3.3.1 发展现状
3.3.2 电梯保有量
3.3.3 维保市场规模
3.3.4 电梯厂商布局维保市场
3.3.5 主要企业维保业务对比
3.4 进出口
3.4.1 进口呈下降趋势
3.4.2 出口稳步增长
3.4.3 进出口单价
3.5 竞争格局
3.5.1 外资品牌在华布局
3.5.2 本土企业融资情况
3.5.3 主要企业经营业绩对比
3.6 总结预测
3.6.1 新梯销量保持增长态势
3.6.2 智能制造成为电梯企业的转型改革方向
3.6.3 电梯企业维保服务实现产业化
3.6.4 行业集中度进一步提升
第四章 中国电梯行业需求分析
4.1 下游需求分析
4.2 需求构成分析
4.3 需求影响因素分析
4.3.1 房地产行业
4.3.2 城镇化
4.3.3 老龄化
4.3.4 城市轨道交通
4.3.5 旧梯更新改造
第五章 国内相关企业
5.1 上海机电
5.1.1 公司简介
5.1.2 经营情况
5.1.3 营收构成
5.1.4 毛利率
5.1.5 电梯业务
5.1.6 上海三菱电梯
5.1.7 三菱电机上海机电电梯有限公司
5.1.8 研发投资
5.1.9 发展战略
5.2 广日股份
5.2.1 公司简介
5.2.2 经营情况
5.2.3 营收构成
5.2.4 毛利率
5.2.5 电梯业务
5.2.6 广日电梯
5.2.7 研发投资
5.2.8 发展战略
5.3 康力电梯
5.3.1 公司简介
5.3.2 经营情况
5.3.3 营收构成
5.3.4 毛利率
5.3.5 电梯业务
5.3.6 研发投资
5.3.7 发展战略
5.4 江南嘉捷
5.4.1 公司简介
5.4.2 经营情况
5.4.3 营收构成
5.4.4 毛利率
5.4.5 电梯业务
5.4.6 国内外经典项目
5.4.7 研发投资
5.4.8 发展战略
5.5 远大智能
5.5.1 公司简介
5.5.2 经营情况
5.5.3 营收构成
5.5.4 毛利率
5.5.5 电梯业务
5.5.6 研发投资
5.5.7 发展战略
5.6 东南电梯
5.6.1 公司简介
5.6.2 经营情况
5.6.3 营收构成
5.6.4 毛利率
5.6.5 主要客户
5.6.6 特种电梯典型项目
5.6.7 发展战略
5.7 奔速电梯
5.7.1 公司简介
5.7.2 经营情况
5.7.3 营收构成
5.7.4 毛利率
5.7.5 主要客户
5.7.6 典型项目
5.7.7 研发投资
5.7.8 发展战略
5.8 信达智能
5.8.1 公司简介
5.8.2 经营情况
5.8.3 营收构成
5.8.4 毛利率
5.8.5 主要客户
5.8.6 典型项目
5.8.7 研发投资
5.9 莱茵电梯
5.9.1 公司简介
5.9.2 经营情况
5.9.3 营收构成
5.9.4 毛利率
5.9.5 主要客户
5.9.6 研发投资
5.9.7 发展战略
5.10 申龙电梯
5.10.1 公司简介
5.10.2 经营情况
5.10.3 营收构成
5.10.4 毛利率
5.10.5 电梯产能及产销量
5.10.6 主要客户
5.10.7 典型项目
第六章 国外主要企业
6.1 Otis
6.1.1 公司简介
6.1.2 经营情况
6.1.3 订单情况
6.1.4 在华发展
6.1.5 奥的斯机电
6.1.6 奥的斯电机主要电梯订单
6.2 Hitachi
6.2.1 公司简介
6.2.2 经营情况
6.2.3 电梯业务
6.2.4 在华发展
6.2.5 在华订单
6.3 Schindler
6.3.1 公司简介
6.3.2 经营情况
6.3.3 订单情况
6.3.4 在华发展
6.3.5 在华订单
6.4 ThyssenKrupp
6.4.1 公司简介
6.4.2 经营情况
6.4.3 电梯业务
6.4.4 在华发展
6.4.5 在华订单
6.5 Toshiba
6.5.1 公司简介
6.5.2 经营情况
6.5.3 电梯业务
6.5.4 在华发展
6.5.5 在华订单
6.6 Fujitec
6.6.1 公司简介
6.6.2 经营情况
6.6.3 订单情况
6.6.5 在华发展
6.7 Kone
6.7.1 公司简介
6.7.2 经营情况
6.7.3 营收构成
6.7.4 在华发展
6.7.5 在华订单
1. Overview of Elevator Industry
1.1 Definition and Classification
1.2 Policy Environment
2. Development of Global Elevator Industry
2.1 New Elevator Market
2.1.1 Sales Volume
2.1.2 New Elevator Sales by Region
2.2 Maintenance Market
2.2.1 Elevator Ownership
2.2.2 Maintenance Market Becomes a Major Growth Engine
2.3 Competitive Landscape
2.4 Development Mode
2.4.1 Two Modes
2.4.2 Business Development in Asia Pacific
2.4.3 Global Expansion
3. Development of China Elevator Industry
3.1 Product Structure
3.2 New Elevator Market
3.2.1 Status Quo
3.2.2 Sales Volume
3.2.3 Sales Volume of Major Enterprises
3.2.4 Market Size of Newly-installed Elevators
3.3 Maintenance Market
3.3.1 Status Quo
3.3.2 Elevator Ownership
3.3.3 Maintenance Market Size
3.3.4 Layout of Domestic Elevator Manufacturers in Maintenance Market
3.3.5 Maintenance Business Comparison between Major Enterprises
3.4 Import and Export
3.4.1 Import Tends to Decline
3.4.2 Export Grows Steadily
3.4.3 Import and Export Unit Price
3.5 Competitive Landscape
3.5.1 Layout of Foreign Brands in China
3.5.2 Financing of Local Enterprises
3.5.3 Operating Result Comparison between Major Enterprises
3.6 Summary & Forecast
3.6.1 New Elevator Keeps growing sales
3.6.2 Intelligent Manufacturing to become transformation direction of elevator enterprises
3.6.3 Maintenance Service to realize industrialization
3.6.4 Industry concentration to be enhanced further
4. Demand of China Elevator Industry
4.1 Downstream Demand Structure
4.2 Demand Composition
4.3 Influencing Factors
4.3.1 Real Estate Sector
4.3.2 Urbanization
4.3.3 Aging Population
4.3.4 Urban Rail Transit
4.3.5 Renewal and Upgrading of Old Elevators
5. Key Elevator Companies in China
5.1 Shanghai Mechanical & Electrical Industry Co., Ltd.
5.1.1 Profile
5.1.2 Operation
5.1.3 Revenue Structure
5.1.4 Gross Margin
5.1.5 Elevator Business
5.1.6 Shanghai Mitsubishi Elevator Co., Ltd.
5.1.7 Mitsubishi Electric Shanghai Electric Elevator Co., Ltd.
5.1.8 R&D Investment
5.1.9 Development Strategy
5.2 Guangzhou Guangri Stock Co., Ltd.
5.2.1 Profile
5.2.2 Operation
5.2.3 Revenue Structure
5.2.4 Gross Margin
5.2.5 Elevator Business
5.2.6 Guangri Elevator
5.2.7 R&D Investment
5.2.8 Development Strategy
5.3 Canny Elevator Co., Ltd.
5.3.1 Profile
5.3.2 Operation
5.3.3 Revenue Structure
5.3.4 Gross Margin
5.3.5 Elevator Business
5.3.6 R&D Investment
5.3.7 Development Strategy
5.4 SJEC Corporation
5.4.1 Profile
5.4.2 Operation
5.4.3 Revenue Structure
5.4.4 Gross Margin
5.4.5 Elevator Business
5.4.6 Typical Projects
5.4.7 R&D Investment
5.4.8 Development Strategy
5.5 Shenyang Yuanda Intellectual Industry Group Co., Ltd.
5.5.1 Profile
5.5.2 Operation
5.5.3 Revenue Structure
5.5.4 Gross Margin
5.5.5 Elevator Business
5.5.6 R&D Investment
5.5.7 Development Strategy
5.6 Dongnan Elevator Co., Ltd.
5.6.1 Profile
5.6.2 Operation
5.6.3 Revenue Structure
5.6.4 Gross Margin
5.6.5 Major Customers
5.6.6 Special Elevator Typical Projects
5.6.7 Development Strategy
5.7 Shandong Bunse Elevator Co., Ltd.
5.7.1 Profile
5.7.2 Operation
5.7.3 Revenue Structure
5.7.4 Gross Margin
5.7.5 Major Customers
5.7.6 Typical Projects
5.7.7 R&D Investment
5.7.8 Development Strategy
5.8 Hunan Sinda Elevator Co., Ltd.
5.8.1 Profile
5.8.2 Operation
5.8.3 Revenue Structure
5.8.4 Gross Margin
5.8.5 Major Customers
5.8.6 Typical Projects
5.8.7 R&D Investment
5.9 Rhine Elevator
5.9.1 Profile
5.9.2 Operation
5.9.3 Revenue Structure
5.9.4 Gross Margin
5.9.5 Major Customers
5.9.6 R&D Investment
5.9.7 Development Strategy
5.10 Shenlong Elevator Co., Ltd.
5.10.1 Profile
5.10.2 Operation
5.10.3 Revenue Structure
5.10.4 Gross Margin
5.10.5 Elevator Capacity, Output and Sales Volume
5.10.6 Major Customers
5.10.7 Typical Projects
6. Key Foreign Elevator Companies
6.1 Otis
6.1.1 Profile
6.1.2 Operation
6.1.3 Orders
6.1.4 Development in China
6.1.5 Otis Electric
6.1.6 Elevator Orders of Otis Electric
6.2 Hitachi
6.2.1 Profile
6.2.2 Operation
6.2.3 Elevator Business
6.2.4 Development in China
6.2.5 Orders in China
6.3 Schindler
6.3.1 Profile
6.3.2 Operation
6.3.3 Orders
6.3.4 Development in China
6.3.5 Orders in China
6.4 ThyssenKrupp
6.4.1 Profile
6.4.2 Operation
6.4.3 Elevator Business
6.4.4 Development in China
6.4.5 Orders in China
6.5 Toshiba
6.5.1 Profile
6.5.2 Operation
6.5.3 Elevator Business
6.5.4 Development in China
6.5.5 Orders in China
6.6 Fujitec
6.6.1 Profile
6.6.2 Operation
6.6.3 Orders
6.6.4 Development in China
6.7 Kone
6.7.1 Profile
6.7.2 Operation
6.7.3 Revenue Structure
6.7.4 Development in China
6.7.5 Orders in China
表:电梯产品分类
表:电梯主要组成部件
表:2006-2018年中国电梯行业相关政策
图:2010-2018年全球新梯销量及同比增长率
图:2010-2017年全球新梯销售量(分地区)
图:2010-2017年全球新梯销售量占比(分地区)
图:2015-2017年全球新梯销售额占比(分地区)
图:2004-2016年全球新装电梯订单量占比(分地区)
图:2010-2030年全球主要国家电梯每千人保有量及城镇化率
图:2013-2022年全球电梯保有量
图:2005-2018年通力维保收入占比
图:2017年全球电梯市场份额(分企业)
图:2017年通力销售额占比TOP10(分国家)
表:通力集团并购案例及影响
表:迅达集团并购案例
图:电梯产品结构
图:2005-2017年中国中低速电梯产品市场份额
图:2012-2017年中国电梯销量
表:2014-2017年中国主要电梯企业新梯销量
图:2017年中国电梯企业新梯销量占比
图:2015-2018年中国电梯企业新梯销售额对比
图:2012-2017年中国新梯市场规模
图:2017年中国新梯市场份额(分企业)
图:2015-2022年中国电梯保有量
图:2015-2022年中国电梯维保市场规模
表:2014-2018年中国主要电梯企业安装维保业务收入及占总营收比重
图:2017年中国电梯行业市场份额(分企业)
表:中国本土电梯企业与国际电梯巨头在高速电梯领域的布局对比
表:主要外资品牌电梯在华布局情况
表:2011-2018年国外电梯企业在华发展动态
表:2013-2018年中国主要电梯企业营业收入对比
表:2013-2018年中国主要电梯企业净利润对比
图:2017-2022年中国新梯销量
表:中国主要电梯企业电梯维保服务布局情况
图:中国电梯下游需求结构
图:电梯需求市场组成
图:2010-2018年中国房地产开发投资完成额
图:2013-2018年中国商品房销售面积及同比增长率
图:2013-2018年中国商品房销售额及同比增长率
图:2013-2018年中国房屋新开工面积及同比增长率
图:2010-2017年中国城镇化率
表:新型城镇化下的电梯需求特点
图:2010-2017年中国60岁以上老年人口占比
图:2012-2017年中国城市轨道交通运营总里程
表:2010-2024年中国需更新的电梯数量
图:2013-2018年上海机电营业收入及净利润
图:2014-2018年上海机电营业收入(分产品)
图:2014-2018年上海机电营业收入构成(分产品)
图:2014-2017年上海机电毛利率(分产品)
图:2014-2017年上海机电电梯产销及库存量
图:2014-2018年上海三菱电梯经营业绩
图:2014-2018年上海三菱电梯安装维保业务收入及占比
表:2018上半年上海三菱电梯承接的主要重大项目
图:2014-2018年三菱电机上海机电电梯有限公司经营业绩
图:2014-2018年上海机电研发支出及占总营收比
图:2013-2018年广日股份营业收入及净利润
图:2014-2017年广日股份营业收入(分产品)
图:2014-2017年广日股份营业收入构成(分产品)
图:2014-2017年广日股份营业收入(分地区)
图:2014-2017年广日股份营业收入构成(分地区)
图:2014-2017年广日股份毛利率
图:2014-2017年广日股份毛利率(分产品)
表:广日股份主要生产基地
图:广日电梯典型项目
表:2015-2017年广日股份产销情况
表:2014-2017年广日电梯经营数据
图:2013-2018年广日股份研发支出及占总营收比重
图:康力电梯生产基地布局
图:康力电梯全球布局
图:康力电梯主要客户
图:2013-2018年康力电梯营业收入及净利润
图:2014-2018年康力电梯营业收入(分产品)
图:2014-2018年康力电梯营业收入构成(分产品)
图:2014-2018年康力电梯营业收入(分地区)
图:2014-2018年康力电梯营业收入构成(分地区)
图:2014-2018年康力电梯毛利率
图:2014-2018年康力电梯毛利率(分产品)
图:康力电梯主要产品及应用范围
图:康力电梯典型项目
表:2014-2017年康力电梯产销量及库存量
图:2013-2018年康力电梯研发支出及占比
图:2013-2017年江南嘉捷营业收入及净利润
图:2014-2017年江南嘉捷营业收入(分产品)
图:2014-2017年江南嘉捷营业收入构成(分产品)
图:2014-2017年江南嘉捷毛利率(分产品)
表:2013-2017年江南嘉捷产销及库存量
图:江南嘉捷国内经典项目
图:江南嘉捷国外经典项目
图:2014-2017年江南嘉捷研发支出及占比
图:2013-2018年远大智能营业收入及净利润
表:2014-2018年远大智能营业收入(分产品)
表:2014-2018年远大智能营业收入构成(分产品)
图:2014-2018年远大智能毛利率
图:2014-2018年远大智能主要产品毛利率
表:远大智能精品工程
表:2014-2017年远大智能产销及库存量
图:2013-2018年远大智能研发支出及占比
表:东南电梯特种电梯产品应用案例
图:2013-2018年东南电梯营业收入及净利润
表:2013-2018年东南电梯营业收入(分产品)
表:2013-2018年东南电梯营业收入构成(分产品)
图:2013-2018年东南电梯毛利率
表:2013-2017年东南电梯前五名客户销售额及占比
图:东南电梯特种电梯典型项目
图:2013-2018年奔速电梯营业收入及净利润
图:2013-2017年奔速电梯营业收入(分产品)
图:2013-2017年奔速电梯营业收入构成(分产品)
图:2013-2018年奔速电梯毛利率
表:2014-2017年奔速电梯前五名客户销售额及占比
图:奔速电梯典型项目
图:2013-2017年奔速电梯研发支出及占比
图:2013-2018年信达智能营业收入及净利润
表:2013-2017年信达智能营业收入(分产品)
表:2013-2017年信达智能营业收入构成(分产品)
图:2013-2018年信达智能毛利率
表:2014-2017年信达智能前五名客户销售额及占比
图:信达智能典型项目
图:2013-2017年信达智能研发支出及占比
表:莱茵电梯主要技术
表:莱茵电梯主要电梯产品
图:2013-2018年莱茵电梯营业收入及净利润
图:2013-2017年莱茵电梯营业收入(分产品)
图:2013-2017年莱茵电梯营业收入构成(分产品)
图:2013-2018年莱茵电梯毛利率
表:2013-2017年莱茵电梯前五名客户销售额及占比
图:2013-2017年莱茵电梯研发支出及占比
图:2012-2014年申龙电梯营业收入及净利润
图:2012-2014年申龙电梯营业收入(分产品)
图:2012-2014年申龙电梯营业收入(分地区)
图:2012-2014年申龙电梯营业收入构成(分地区)
图:2012-2014年申龙电梯毛利(分产品)
图:2012-2014年申龙电梯毛利率(分产品)
图:2012-2014年申龙电梯产能
图:2012-2014年申龙电梯销量(分产品)
图:2012-2014年申龙电梯产品单价
图:2012-2014年申龙电梯外销前五大客户
表:2012-2014年申龙电梯配件销售前五大客户
图:申龙电梯国外典型项目
表:Otis SkyRise高速电梯规格参数
表:Otis SkyBuild施工用电梯规格参数
图:奥的斯全球业务分布
图:2012-2017Otis营业收入及营业利润
表:奥的斯中国扩张历程
图:2009-2018年奥的斯在华主要电梯订单
图:奥的斯机电股权结构
图:奥的斯机电主要电梯及扶梯产品
图:2015-2017年奥的斯机电经营数据
表:2011-2018年奥的斯电机主要电梯订单
图:FY2014-2018年日立主要财务指标
图:FY2014-2018年日立营业收入(分地区)
图:FY2017-2018年日立财务指标(分部门)
图:FY2015-2017年日立Social Infrastructure & Industrial Systems Segment财务数据
图:日立电梯业务全球布局
图:日立电梯发展历程
表:FY2017年日立主要项目
表:日立电梯(中国)有限公司简介
表:日立中国主要电梯制造基地
图:2011-2018年日立电梯(中国)营业收入及净利润
表:2011-2018年日立在华主要电梯订单
图:迅达集团发展历程
图:迅达全球分布
图:1981-2017年迅达市值
图:迅达集团主要产品
图:2013-2017年迅达经营业绩
图:2016-2017年迅达营业收入构成(分地区)
图:2011-2017年迅达未交付订单金额及同比增长率
图:2005-2017年迅达集团营业收入与未交付订单构成(分地区)
图:迅达未来重要订单(分地区)
表:迅达中国发展历程
图:2015-2017年迅达集团主要在华订单
图:FY2014-2018年ThyssenKrupp订单额和销售额
表:FY2014-2018年ThyssenKrupp订单额(分业务)
表:FY2014-2018年ThyssenKrupp销售额(分业务)
图:FY2014-2018年ThyssenKrupp电梯业务订单额及销售额
表:蒂森在华发展历程
表:蒂森电梯在华生产基地
表:蒂森克虏伯在华主要电梯订单
图:Toshiba业务结构变动情况
图:Toshiba发展历程
图:FY2016-2018年Toshiba财务数据
图:FY2016-2018年Toshiba营业收入(分部门)
图:东芝电梯发展历程
图:东芝电梯主要电梯项目
图:东芝电梯主要扶梯项目
图:富士达全球布局
图:2014-2018年富士达主要财务指标
图:2014-2018年富士达营业收入及经营利润(分地区)
图:2019年富士达营业收入及经营利润预测(分地区)
图:2014-2018年富士达未交付订单额(分地区)
表:富士达主要电梯项目
图:富士达在华布局
图:富士达在华主要电梯项目
图:通力全球业务分布
图:2017-2018年通力财务数据
图:2015-2017年通力财务数据
图:2016-2018年通力营业收入(分地区)
图:2016-2018年通力营业收入(分业务)
图:通力在华主要公司
表:通力集团中国发展历程
表:2016-2018年通力主要在华订单
Classification of Elevator Products
Main Components of Elevator
Laws and Regulations on Chinese Elevator Industry, 2000-2017
Policies on Chinese Elevator Industry, 2006-2018
Global Newly-Installed Elevator Sales Volume, 2010-2018
Global Newly-Installed Elevator Sales Volume by Region, 2010-2017
Global Newly-Installed Elevator Sales Volume Structure by Region, 2010-2017
Global Newly-Installed Elevator Sales Structure by Region, 2015-2017
Share of Global Newly-Installed Elevator Orders (by Region), 2004-2016
Elevator Ownership per 1000 People and Utilization Rate in Major Countries, 2010-2030E
Global Elevator Ownership, 2013-2022E
KONE’s Maintenance Revenue as a Percentage of Total Revenue, 2005-2018
Global Elevator Market Share, 2017
Top 10 Countries of KONE’s Revenue, 2017
KONE’s M&A Cases and Their Influences
Schindler’s M&A Cases
Structure of Elevator Product
Market Share of Medium/Low Speed Elevator Product in China, 2005-2017
China’s Elevator Sales Volume, 2012-2017
Newly-installed Elevator Sales Volume of Major Chinese Elevator Enterprises, 2014-2017
Structure of China’s Newly-installed Elevator Sales Volume (by Enterprise), 2017
Newly-installed Elevator Sales of Major Chinese Elevator Enterprises, 2015-2018
Market Size of Newly-installed Elevators in China, 2012-2017
Market Share of Newly-installed Elevators by Company, 2017
Elevator Ownership in China, 2015-2022E
Elevator Maintenance Market Size in China, 2015-2022E
Major Chinese Elevator Enterprises’ Installation & Maintenance Revenue as a Percentage of Total Revenue, 2014-2018
China’s Passenger Elevator/Escalator/Moving Walk Import Volume and Value, 2010-2015
Top 10 Countries by Passenger Elevator Import Volume in China, 2015
Top 10 Countries by Escalator/Moving Walk Import Volume in China, 2015
China’s Passenger Elevator/Escalator/Moving Walk Export Volume and Value, 2010-2015
Top 10 Chinese Provinces by Passenger Elevator Export Volume, 2015
Top 10 Chinese Provinces by Escalator/Moving Walk Export Volume, 2015
Top 10 Countries by Passenger Elevator Export Volume in China, 2015
Top 10 Countries by Escalator/Moving Walk Export Volume in China, 2015
China’s Passenger Elevator Import and Export Price, 2010-2015
China’s Escalator/Moving Walk Import and Export Price, 2010-2015
Market Share of Elevator Industry in China (by Enterprise), 2017
Comparison between Chinese and International Enterprises in High Speed Elevator Layout
Layout of Major Foreign Elevator Brands in China
Developments of Foreign Elevator Enterprises in China, 2011-2018
Comparison of Revenue from Major Chinese Elevator Enterprises, 2013-2018
Comparison of Net Income from Major Chinese Elevator Enterprises, 2013-2018
Sales Volume of Newly-installed Elevators in China, 2017-2022E
Elevator Maintenance Service Layout of Major Chinese Elevator Companies
Elevator Downstream Demand Structure in China
Elevator Demand Market Components
Factors Influencing Elevator Demand Market Segments
Composition of Elevator Demand in China, 2017
Completed Investment in China’s Real Estate Development, 2010-2018
Commercial Residential Building Sales Area in China, 2013-2018
Commercial Residential Building Sales in China, 2013-2018
Floor Space Newly Started in China, 2013-2018
Urbanization Rate in China, 2010-2017
Characteristics of Demand for Elevators under the New-type Urbanization
Proportion of Population Aged 60 or Above in China, 2010-2017
Total Operating Mileage of Urban Rail Transit in China, 2012-2017
Number of Elevators to Be Updated in China, 2010-2024E
Revenue and Net Income of Shanghai Mechanical & Electrical Industry, 2013-2018
Revenue Breakdown of Shanghai Mechanical & Electrical Industry (by Product), 2014-2018
Revenue Structure of Shanghai Mechanical & Electrical Industry (by Product), 2014-2018
Gross Margin of Shanghai Mechanical & Electrical Industry (by Product), 2014-2017
Output, Sales Volume and Inventory of Shanghai Mechanical & Electrical Industry, 2014-2017
Operating Performance of Shanghai Mitsubishi Elevator, 2014-2018
Installation & Maintenance Revenue of Shanghai Mitsubishi Elevator, 2014-2018
Major Orders of Shanghai Mitsubishi Elevator, 2018H1
Milestones in Development of Shanghai Mitsubishi Elevator
Operating Performance of Mitsubishi Electric Shanghai Electric Elevator, 2014-2018
R&D Costs and % of Total Revenue of Shanghai Mechanical & Electrical Industry, 2014-2018
Revenue and Net Income of Guangzhou Guangri Stock, 2013-2018
Revenue Breakdown of Guangzhou Guangri Stock (by Product), 2014-2017
Revenue Structure of Guangzhou Guangri Stock (by Product), 2014-2017
Revenue Breakdown of Guangzhou Guangri Stock (by Region), 2014-2017
Revenue Structure of Guangzhou Guangri Stock (by Region), 2014-2017
Gross Margin of Guangzhou Guangri Stock, 2014-2017
Gross Margin of Guangzhou Guangri Stock (by Product), 2014-2017
Typical Projects of Guangzhou Guangri Elevator Industry
Production and Sales of Guangzhou Guangri Stock, 2015-2017
Financial Indexes of Guangzhou Guangri Elevator Industry, 2014-2017
R&D Costs and % of Total Revenue of Guangzhou Guangri Stock, 2013-2018
Production Base Layout of Canny Elevator
Global Layout of Canny Elevator
Major Customers of Canny Elevator
Revenue and Net Income of Canny Elevator, 2013-2018
Revenue Breakdown of Canny Elevator (by Product), 2014-2018
Revenue Structure of Canny Elevator (by Product), 2014-2018
Revenue Breakdown of Canny Elevator (by Region), 2014-2018
Revenue Structure of Canny Elevator (by Region), 2014-2018
Gross Margin of Canny Elevator, 2014-2018
Gross Margin of Canny Elevator (by Product), 2014-2018
Major Products and Application Scope of Canny Elevator
Typical Projects of Canny Elevator
Output and Sales Volume, Inventory of Canny Elevator, 2014-2017
R&D Costs and % of Total Revenue of Canny Elevator, 2013-2018
Revenue and Net Income of SJEC Corporation, 2013-2017
Revenue Breakdown of SJEC Corporation (by Product), 2014-2017
Revenue Structure of SJEC Corporation (by Product), 2014-2017
Gross Margin of SJEC Corporation (by Product), 2014-2017
Production and Sales Volume, Inventory of SJEC Corporation (by Product), 2013-2017
Typical Projects of SJEC Corporation in China
Typical Overseas Projects of SJEC Corporation
R&D Costs of SJEC Corporation, 2014-2017
Revenue and Net Income of Shenyang Yuanda Intellectual Industry Group, 2013-2018
Revenue Breakdown of Shenyang Yuanda Intellectual Industry Group (by Product), 2014-2018
Revenue Structure of Shenyang Yuanda Intellectual Industry Group (by Product), 2014-2018
Gross Margin of Shenyang Yuanda Intellectual Industry Group, 2014-2018
Gross Margin of Shenyang Yuanda Intellectual Industry Group (by Product), 2014-2018
Typical Projects of Shenyang Yuanda Intellectual Industry Group
Production and Sales, Inventory of Shenyang Yuanda Intellectual Industry Group, 2014-2017
R&D Costs of Shenyang Yuanda Intellectual Industry Group, 2013-2018
Revenue and Net Income of Dongnan Elevator, 2013-2018
Revenue Breakdown of Dongnan Elevator (by Product), 2013-2018
Revenue Structure of Dongnan Elevator (by Product), 2013-2018
Gross Margin of Dongnan Elevator, 2013-2018
Dongnan Elevator’s Revenue from Top 5 Customers, 2013-2017
Typical Projects for Special Elevators of Dongnan Elevator
Revenue and Net Income of Shandong Bunse Elevator, 2013-2018
Revenue Breakdown of Shandong Bunse Elevator (by Business), 2013-2017
Revenue Structure of Shandong Bunse Elevator (by Business), 2013-2017
Gross Margin of Shandong Bunse Elevator, 2013-2018
Top 5 Customers of Shandong Bunse Elevator, 2014-2017
Typical Projects of Shandong Bunse Elevator
R&D Costs of Shandong Bunse Elevator, 2013-2017
Revenue and Net Income of Hunan Sinda Elevator, 2013-2018
Revenue Breakdown of Hunan Sinda Elevator (by Business), 2013-2017
Revenue Structure of Hunan Sinda Elevator (by Business), 2013-2017
Gross Margin of Hunan Sinda Elevator, 2013-2018
Hunan Sinda Elevator’s Revenue from Top 5 Customers, 2014-2017
Typical Projects of Hunan Sinda Elevator
R&D Costs and % of Total Revenue of Hunan Sinda Elevator, 2013-2017
Main Technologies of Rhine Elevator
Main Elevator Products of Rhine Elevator
Revenue and Net Income of Rhine Elevator, 2013-2018
Revenue Breakdown of Rhine Elevator (by Business), 2013-2017
Revenue Structure of Rhine Elevator (by Business), 2013-2017
Gross Margin of Rhine Elevator, 2013-2018
Revenue from Top 5 Customers of Rhine Elevator, 2013-2017
R&D Costs of Rhine Elevator, 2013-2017
Revenue and Net Income of Shenlong Elevator, 2012-2014
Revenue Breakdown of Shenlong Elevator (by Product), 2012-2014
Revenue Breakdown of Shenlong Elevator (by Region), 2012-2014
Revenue Structure of Shenlong Elevator (by Region), 2012-2014
Gross Profit of Shenlong Elevator (by Product), 2012-2014
Gross Margin of Shenlong Elevator (by Product), 2012-2014
Capacity of Shenlong Elevator, 2012-2014
Sales Volume of Shenlong Elevator (by Product), 2012-2014
Unit Product Price of Shenlong Elevator, 2012-2014
Top 5 Export Customers of Shenlong Elevator, 2012-2014
Top 5 Accessories Sales Customers of Shenlong Elevator, 2012-2014
Typical Overseas Projects of Shenlong Elevator
SkyRise Specifications of Otis
Otis SkyBuild Specifications
Business Distribution of Otis
Net Sales and Operating Profit of Otis, 2012-2017
Expansion Process of Otis in China
Major Elevator Orders for Otis in China, 2009-2018
Equity Structure of Otis Electric
Major Elevator and Escalator Products of Otis Electric
Financial Indices of Otis Electric, 2015-2017
Elevator Orders of Otis Electric, 2011-2018
Main Financial Indexes of Hitachi, FY2014-2018
Revenue Structure of Hitachi (by Region), FY2014-FY2018
Financial Indices of Hitachi (by Division), FY2017-FY2018
Financial Indices of Social Infrastructure & Industrial Systems Segment of Hitachi, FY2015-FY2017
Global Layout of Hitachi Elevators
Development History of Hitachi Elevators
Main Elevator Projects of Hitachi, FY2017
Profile of Hitachi Elevator (China)
Major Elevator Manufacturing Bases of Hitachi in China
Revenue and Net Income of Hitachi Elevator (China), 2011-2018
Main Elevator Orders of Hitachi in China, 2011-2018
Development History of Schindler
Global Footprint of Schindler
Market Capitalization of Schindler, 1981-2017
Major Products of Schindler
Performance of Schindler, 2013-2017
Revenue Structure of Schindler by Region, 2016-2017
Amount of Schindler’s Undelivered Orders, 2011-2017
Structure of Schindler’s Revenue and Undelivered Orders (by Region), 2005-2017
Future Significant Orders by Region of Schindler
Development Course of Schindler China
Main Orders of Schindler in China, 2015-2017
Order Amount and Sales of ThyssenKrupp, FY2014-FY2018
Order Amount of ThyssenKrupp (by Business), FY2014-FY2018
Sales of ThyssenKrupp (by Business), FY2014-FY2018
Elevator Order Amount and Sales of ThyssenKrupp Elevators, FY2014-FY2018
Development Course of ThyssenKrupp in China
Production Bases of ThyssenKrupp Elevator in China
Main Elevator Orders of ThyssenKrupp in China
Business Structure Change of Toshiba
Development History of Toshiba
Main Financial Indices of Toshiba, FY2016-FY2018
Revenue of Toshiba by Division, FY2016-FY2018
Development History of Toshiba Elevators
Main Elevator Projects of Toshiba
Main Escalator Projects of Toshiba
Global Layout of Fujitec
Main Financial Indexes of Fujitec, FY2014-FY2018
Net Sales of Fujitec (by Region), FY2014-FY2018
Net Sales of Fujitec (by Region), FY2019
Order Backlogs of Fujitec by Region, FY2014-FY2018
Main Elevator Projects of Fujitec
Layout of Fujitec in China
Main Elevator Projects of Fujitec in China
Global Business Distribution of KONE
Main Financial Indices of KONE, 2017-2018
Main Financial Indices of KONE, 2015-2017
Revenue Structure of KONE (by Region), 2016-2018
Revenue Structure of KONE (by Business), 2016-2018
Dominant Companies of KONE in China
Development History of KONE in China
Main Orders of KONE in China, 2016-2018
如果这份报告不能满足您的要求,我们还可以为您定制报告,请 留言说明您的详细需求。
|